⏳ How to Create Clear Interval Plots in Python for Data Visualization
Learn step-by-step how to generate effective interval plots in Python to visualize data ranges easily and accurately. Perfect for data analysis and presentation!
AI_Evolutionary Technology
1 views • May 27, 2025
About this video
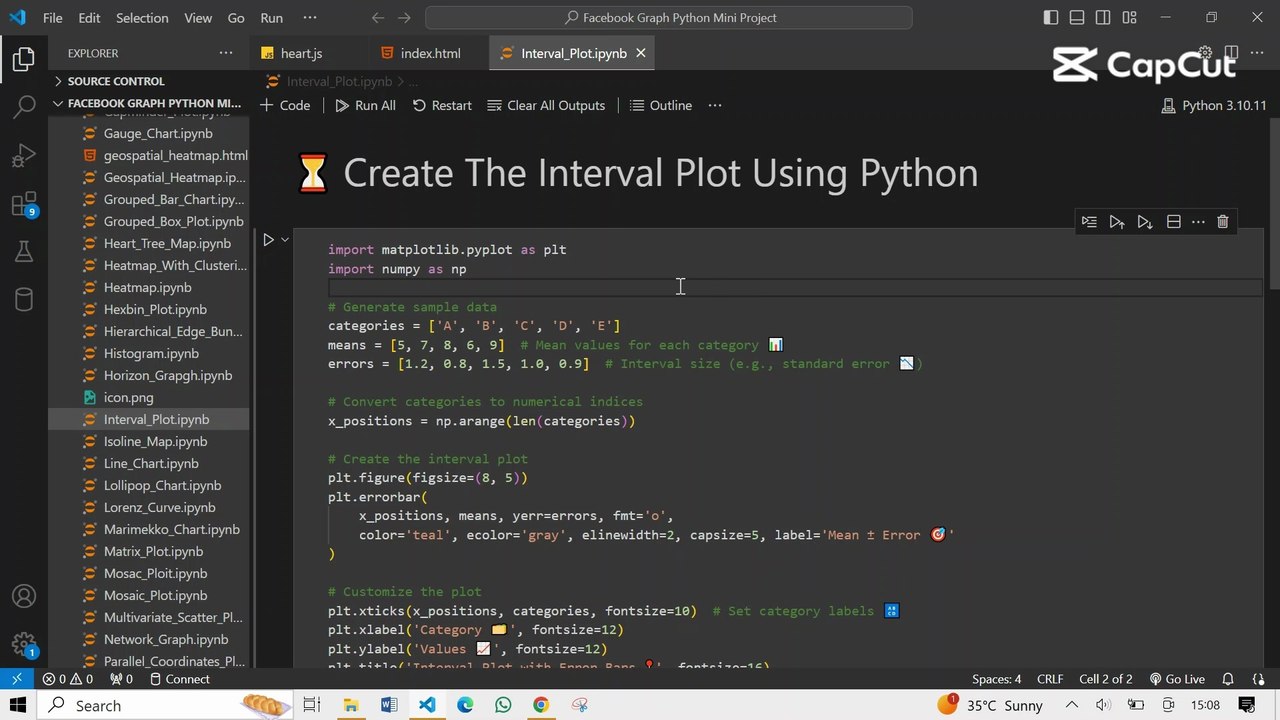
The phrase "⏳ Create The Interval Plot Using Python" refers to generating a visualization that displays data across intervals or ranges using Python. An interval plot helps show variability or confidence intervals in datasets, commonly used in statistics and data analysis.
Video Information
Views
1
Duration
1:44
Published
May 27, 2025