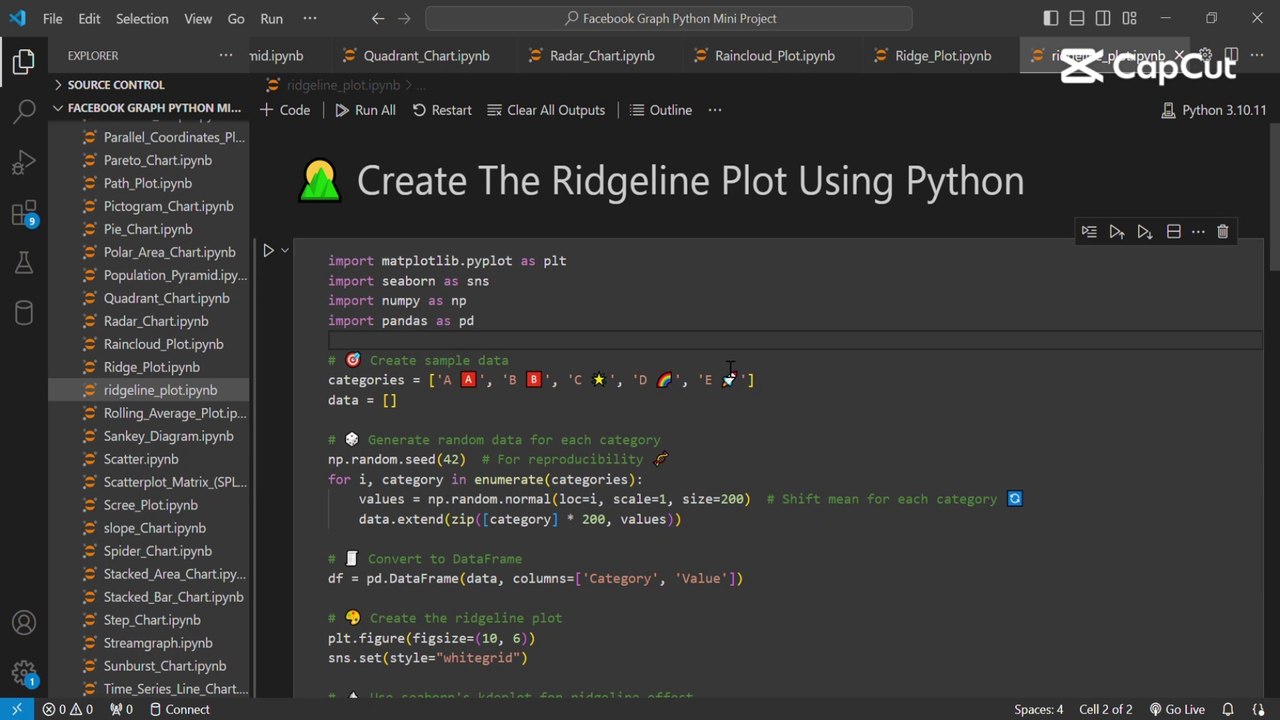
How to Create Stunning Ridgeline Plots in Python with Seaborn 🌄
Learn to visualize multiple data distributions beautifully with ridgeline plots in Python. Follow this step-by-step guide using Seaborn for elegant and insightful visualizations.
AI_Evolutionary Technology
6 views • May 21, 2025
About this video
Unlock the power of ridgeline plots to visualize distributions across multiple categories with elegance.<br />Using Seaborn and a few handy tweaks, you can create smooth, layered plots that are both insightful and beautiful.<br />Perfect for comparing trends in data over time or across groups with a stunning visual appeal. 🌈
Video Information
Views
6
Duration
1:52
Published
May 21, 2025
Related Trending Topics
LIVE TRENDSRelated trending topics. Click any trend to explore more videos.
No specific trending topics match this video yet.
Explore All Trends