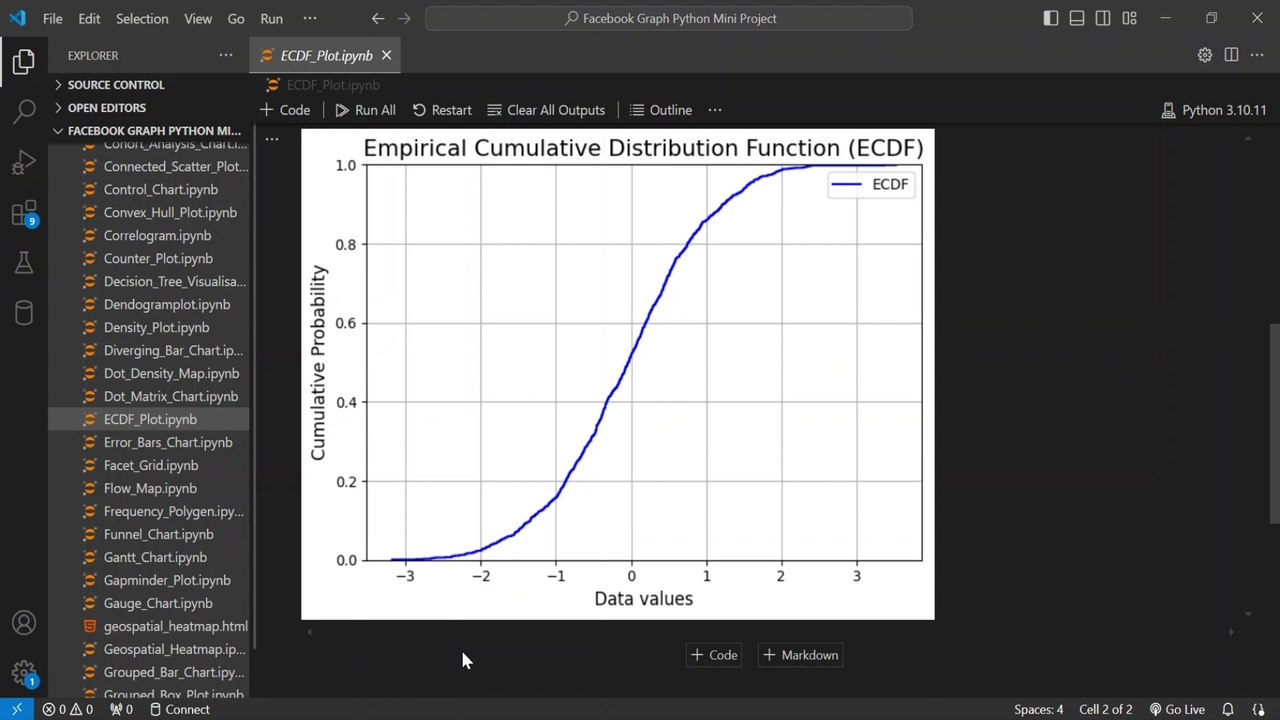
How to Create ECDF Plots with Python's Seaborn 📊
Learn step-by-step how to generate Empirical Cumulative Distribution Function (ECDF) plots using Python and Seaborn to enhance your data analysis skills.
AI_Evolutionary Technology
1 views • May 4, 2025
About this video
In this tutorial, you'll learn how to create Empirical Cumulative Distribution Function (ECDF) plots using Python's Seaborn library. Perfect for data analysis, statistics, and machine learning!<br /><br />🔹 What You'll Learn:<br />✅ What ECDF plots are and when to use them (vs histograms/KDE)<br />✅ Step-by-step guide to creating ECDF plots with Seaborn<br />✅ Customizing plots: colors, labels, styles<br />✅ Practical applications for data analysis<br />✅ Pro tips for interpretation and presentation<br /><br /><br /><br />💬 Got questions? Ask in the comments!<br /><br />👍 Enjoyed this tutorial? Like & Subscribe for more Python content!<br /><br />#Python #DataVisualization #Seaborn #DataScience #ECDF #Statistics #CodingTutorial #PythonTutorial #LearnPython #DataAnalysis #ProgrammingForBeginners
Video Information
Views
1
Duration
1:15
Published
May 4, 2025
Related Trending Topics
LIVE TRENDSRelated trending topics. Click any trend to explore more videos.
No specific trending topics match this video yet.
Explore All Trends