Master Waterfall Charts in Python with Matplotlib 📊
Learn how to create professional waterfall charts in Python with this step-by-step Matplotlib tutorial! Perfect for financial visualizations.
AI_Evolutionary Technology
2 views • May 11, 2025
About this video
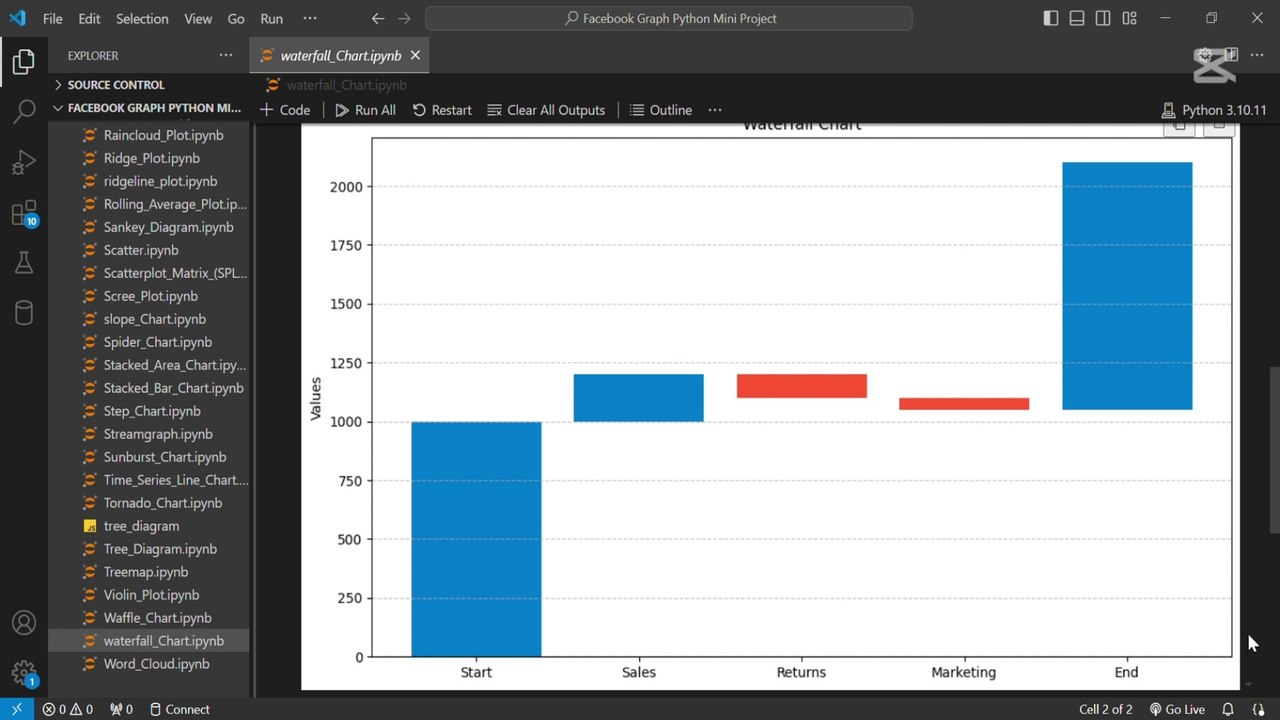
📊 Master Waterfall Charts in Python with this Step-by-Step Matplotlib Tutorial!<br /><br />In this video, you'll learn how to create professional waterfall charts for financial analysis, business reporting, or any data visualization need using Python's Matplotlib and Pandas.<br /><br />🔍 What You'll Learn:<br />✅ How to structure data for waterfall charts<br />✅ Calculate cumulative values with Pandas<br />✅ Customize colors for positive/negative values<br />✅ Add professional styling with grid lines and labels<br />✅ Perfect for financial analysis, profit reporting, and business metrics<br /><br />💬 Let's Connect!<br /><br />Subscribe for more Python data visualization tutorials<br /><br />Like if you found this helpful<br /><br />Comment: "What business metric should I visualize next?"<br /><br />#Python #DataVisualization #WaterfallChart #Matplotlib #Pandas #PythonTutorial #DataScience #FinancialAnalysis #BusinessIntelligence #DataAnalytics #PythonProgramming #Coding #LearnPython #DataViz #TechTutorial
Video Information
Views
2
Duration
2:04
Published
May 11, 2025
Related Trending Topics
LIVE TRENDSRelated trending topics. Click any trend to explore more videos.
No specific trending topics match this video yet.
Explore All Trends