Create Control Charts with Python & HoloViews 📊
Learn how to build Control Charts (SPC charts) using Python and HoloViews for effective process monitoring.
AI_Evolutionary Technology
7 views • May 1, 2025
About this video
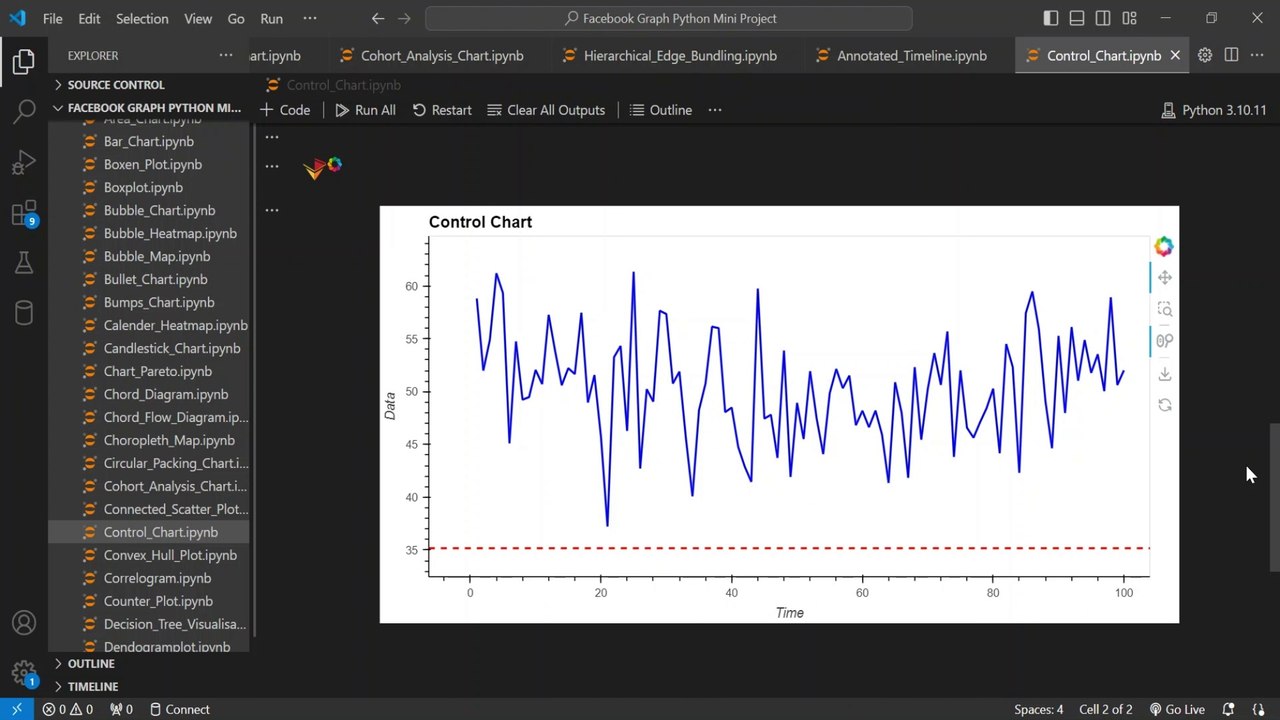
In this tutorial, I’ll show you how to create a Control Chart (also known as a Statistical Process Control (SPC) Chart) using Python. Control charts are essential for monitoring process stability and detecting variations in manufacturing, healthcare, finance, and more.<br /><br />🔹 What You’ll Learn:<br />✔ How to generate synthetic process data using NumPy<br />✔ Calculating Upper Control Limit (UCL) and Lower Control Limit (LCL)<br />✔ Visualizing control charts with HoloViews and Bokeh for interactive plots<br />✔ Customizing the chart for better readability<br />
Video Information
Views
7
Duration
1:53
Published
May 1, 2025
Related Trending Topics
LIVE TRENDSRelated trending topics. Click any trend to explore more videos.
No specific trending topics match this video yet.
Explore All Trends