Create Diverging Bar Charts in Python 📊
Learn to make diverging bar charts in Python with this step-by-step guide for data analysis and visualization.
AI_Evolutionary Technology
8 views • May 3, 2025
About this video
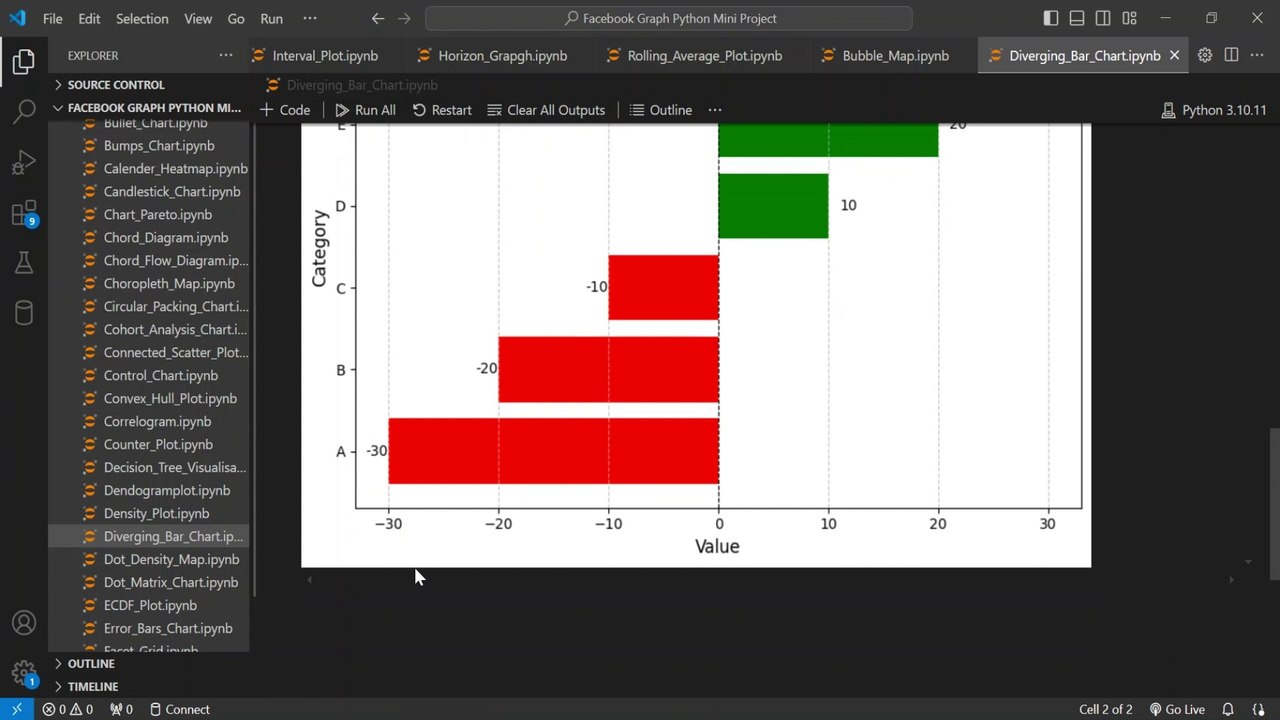
Learn how to create DIVERGING BAR CHARTS in Python with this step-by-step tutorial! Perfect for data analysis, business intelligence, and Python visualization projects.<br /><br />🔹 In this video, you’ll learn:<br />✅ How to use Matplotlib & Pandas to create diverging bar charts<br />✅ How to color-code positive & negative values (red & green)<br />✅ Best practices for customizing labels, grids, and zero-line<br />✅ Real-world applications of diverging charts<br /><br /><br /><br />🔔 Subscribe for more Python & Data Science tutorials!<br /><br />#Python #DataVisualization #Matplotlib #DataScience #PythonTutorial <br />#DataAnalysis #BarChart #Coding #Programming #DataViz <br />#PythonForBeginners #LearnPython #TechTutorial #DataAnalytics<br />
Video Information
Views
8
Duration
1:15
Published
May 3, 2025
Related Trending Topics
LIVE TRENDSRelated trending topics. Click any trend to explore more videos.
No specific trending topics match this video yet.
Explore All Trends