Map Wikidata Easily in R Shiny with Leaflet 🌐
Learn how to visualize Wikidata interactively in R Shiny using the leaflet package with this simple tutorial.
Data For Knowledge
2.6K views • Feb 24, 2022
About this video
Learn the easiest way to map Wikidata in an R Shiny app using the powerful leaflet package for interactive visualizations! This R Shiny tutorial walks you through building a complete mapping application that pulls data directly from Wikidata and displays it on beautiful interactive maps.
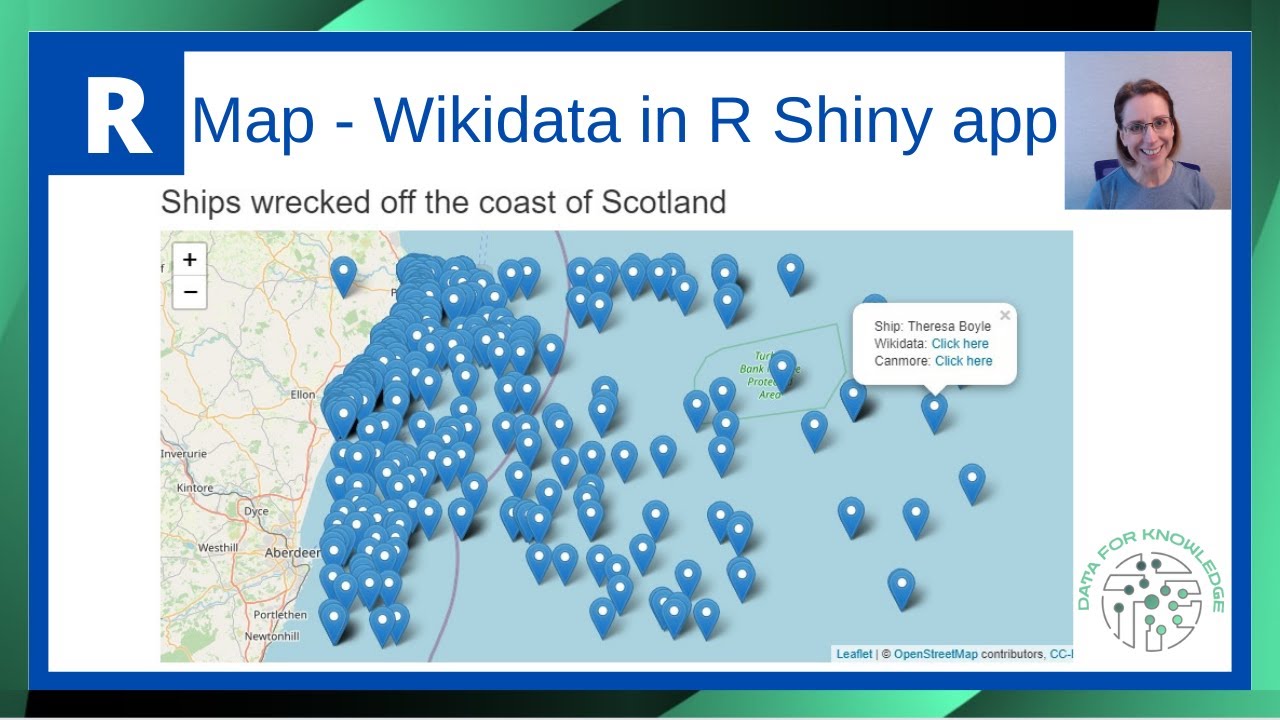
We'll create an R Shiny app together that maps shipwreck locations off the coast of Scotland using live Wikidata as our data source. The leaflet package seamlessly integrates with Shiny to add OpenStreetMap layers, making your Wikidata visualizations both functional and visually appealing.
As we build the app, you'll see how the WikidataQueryServiceR package connects directly to Wikidata, pulling coordinate data that we then process using dplyr and tidyr for proper mapping.
The tutorial demonstrates how to set up your Shiny app interface from scratch, then guides you through the data manipulation steps needed to prepare your Wikidata for visualization. Once the data is ready, we'll use leaflet to create interactive map markers with custom popups that link directly to both Wikidata entries and the Canmore website, giving users detailed information about each shipwreck location.
What makes this approach so powerful is how easily leaflet integrates with R Shiny to handle geographic Wikidata. The entire process requires just a few lines of code to query Wikidata, process coordinates, and render them on a fully interactive map. This same method works for any Wikidata dataset containing location coordinates, opening up endless possibilities for creating R Shiny apps with geographic visualizations.
📩 Free Newsletter: Practical tips on Data, Tools, & Workflow - https://data-for-knowledge.kit.com/signup
The wikicode for this project can be found here - https://w.wiki/4oVa. A separate video explains this query - https://youtu.be/ua5tUfZUDuY.
R packages used in this project:
- shiny
- WikidataQueryServiceR
- leaflet
- tidyr
- dplyr
⏱️ Timestamps:
00:00 Introduction
00:20 View final map created
00:31 Three steps involved to create map
00:45 Gather data from Wikidata
02:00 Code to be used to extract the data
03:05 Set up R Shiny app
07:45 Load the data into R Shiny app
09:45 Manipulate data
13:00 Separate latitude and longitude into separate columns
15:45 Amend data types
17:15 Create URL to link to website which contains info on ship
19:20 Filter size of dataset
22:00 Set up leaflet map
24:20 Add markers to map
25:40 Add popup to map
29:35 Final map with popups
🔗Resources:
📚 Reading - Books from Amazon – https://amzn.to/4jVcnLa
📝 Organising my work with Clickup – https://try.web.clickup.com/8emh4z1sj9w6
Disclosure: I am a participant in the Amazon Services LLC Influencers/Associates program and a participant in the ClickUp Affiliate Program, and I may earn a commission if you click on my referral links and make a purchase. This disclosure is in compliance with the Federal Trade Commission's guidelines on endorsements and testimonials.
✍️ My articles on Medium - https://medium.com/@paulinecairns
Links to references mentioned in video:
- Leaflet map - https://rstudio.github.io/leaflet/
- Components of an R Shiny App - https://shiny.rstudio.com/articles/basics.html
An online version of the final map created in the video can be found here -
https://paulinecairns.shinyapps.io/ShipwrecksMap/
🔔 Like and subscribe to the channel for more R Programming tutorials!
https://www.youtube.com/@DFK_data?sub_confirmation=1
💥 For more R programming tutorials check out the playlist:
https://www.youtube.com/playlist?list=PL856L03J0TRzutyNPb5yD2glKnrcWKpFm
☕ If this tutorial saved you a headache today, you can support the channel via a 'Thanks' or a coffee: https://buymeacoffee.com/dataforknowledge
👉 Follow me on LinkedIn: www.linkedin.com/in/pauline-cairns-data
#RShiny #Wikidata #Leaflet #RProgramming #ShinyApp #DataVisualization #WikidataQuery #LeafletMap #RStudio #InteractiveMaps #OpenStreetMap #DataMapping #ShinyDashboard #RPackages #WikidataQueryServiceR
Tags and Topics
Browse our collection to discover more content in these categories.
Video Information
Views
2.6K
Likes
55
Duration
31:15
Published
Feb 24, 2022
User Reviews
4.5
(2) Related Trending Topics
LIVE TRENDSRelated trending topics. Click any trend to explore more videos.
No specific trending topics match this video yet.
Explore All Trends