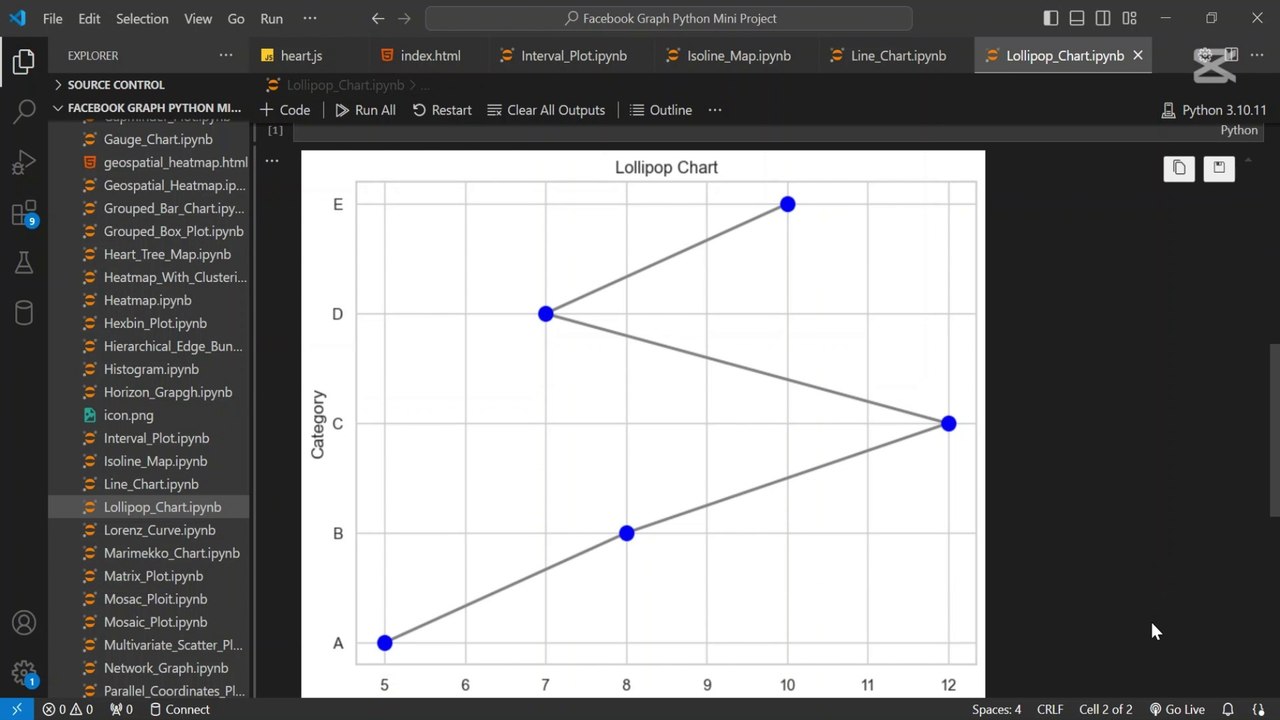
Create a Lollipop Chart in Python 🍭
Learn to make a professional lollipop chart using Python with Matplotlib and Seaborn in simple steps!
AI_Evolutionary Technology
1 views • May 8, 2025
About this video
Learn how to create a professional lollipop chart in Python quickly! In this tutorial, I’ll show you step-by-step how to use Matplotlib and Seaborn to visualize your data with clean, stylish lollipop charts—perfect for reports, presentations, and dashboards.<br /><br />🔹 What You’ll Learn:<br />✅ How to create a lollipop chart in Python<br />✅ Customizing colors, sizes, and styles<br />✅ When to use lollipop charts vs. bar charts<br />✅ Best practices for clear & engaging data visuals<br /><br /><br /><br />📊 Perfect for: Data analysts, Python beginners, and anyone who wants to improve their data visualization skills!<br /><br />👍 Enjoyed the video? Like, Subscribe & Hit the Bell Icon!<br /><br />#PythonDataVisualization #LollipopChart <br />#MatplotlibTutorial #SeabornTutorial <br />#PythonPlotting #DataViz <br />#PythonForBeginners #DataScience <br />#PythonCharts #DataVisualization <br />#PythonTutorial #CodingForBeginners <br />#DataAnalysis #PythonGraphs <br />#LearnPython #TechTutorial
Video Information
Views
1
Duration
1:52
Published
May 8, 2025
Related Trending Topics
LIVE TRENDSRelated trending topics. Click any trend to explore more videos.
No specific trending topics match this video yet.
Explore All Trends