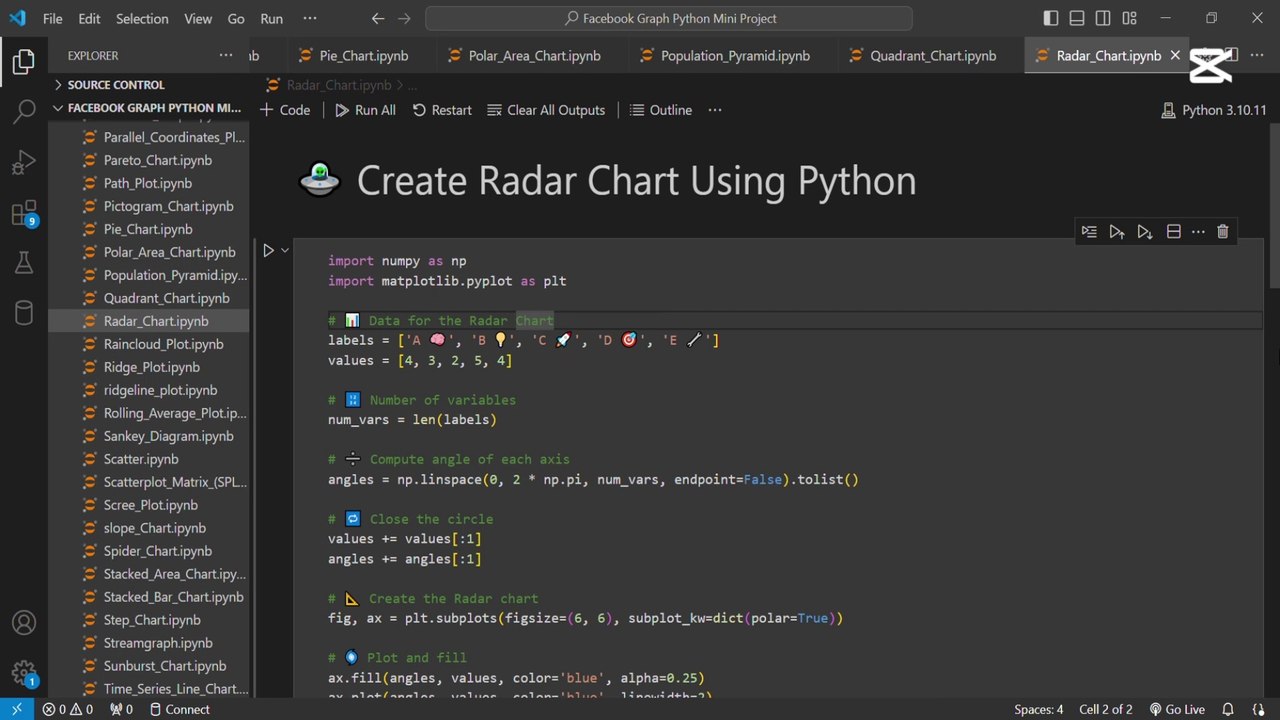
Create a Radar Chart with Python 🐍
Learn how to make radar charts in Python to visualize and compare multivariate data easily. Perfect for multivariable analysis.
AI_Evolutionary Technology
2 views • May 24, 2025
About this video
Radar charts, also known as spider or web charts, are ideal for visualizing multivariate data. They allow easy comparison of several variables by plotting them on axes starting from the same point. <br /><br />Radar charts, also known as spider or web charts, are ideal for visualizing multivariate data. They allow easy comparison of several variables by plotting them on axes starting from the same point. <br /><br /><br /><br /><br /><br />
Video Information
Views
2
Duration
1:58
Published
May 24, 2025
Related Trending Topics
LIVE TRENDSRelated trending topics. Click any trend to explore more videos.
No specific trending topics match this video yet.
Explore All Trends