Create a Pie Chart in Python with Matplotlib
Learn how to make a pie chart using Python's matplotlib library for effective data visualization 🍰.
AI_Evolutionary Technology
4 views • May 24, 2025
About this video
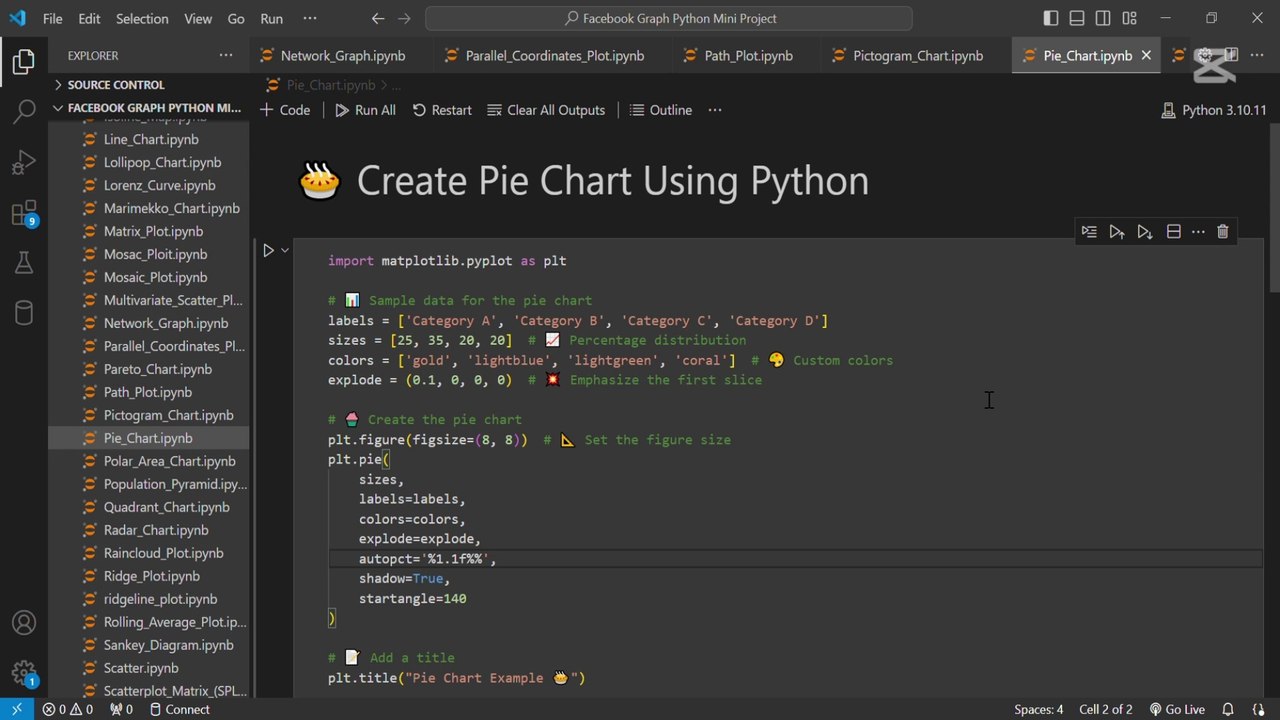
To create a pie chart using Python, you typically use the matplotlib library, which provides simple functions to visualize data. A pie chart displays data as slices of a circle, showing the proportion of each category in a dataset. It’s ideal for visualizing percentage or fractional data in an intuitive, circular format. 📊🥧
Video Information
Views
4
Duration
1:56
Published
May 24, 2025
Related Trending Topics
LIVE TRENDSRelated trending topics. Click any trend to explore more videos.
No specific trending topics match this video yet.
Explore All Trends