Part 2: Power Apps with Excel Creating Filters, Search, Collections, Charts
Part 1 Link: https://www.youtube.com/watch?v=-pwRDC6l1Zk If you are going to use Excel as your backend with Power Apps you should use the strengths of Excel...

Andrew Hess
16.4K views • Sep 12, 2022
About this video
Part 1 Link: https://www.youtube.com/watch?v=-pwRDC6l1Zk
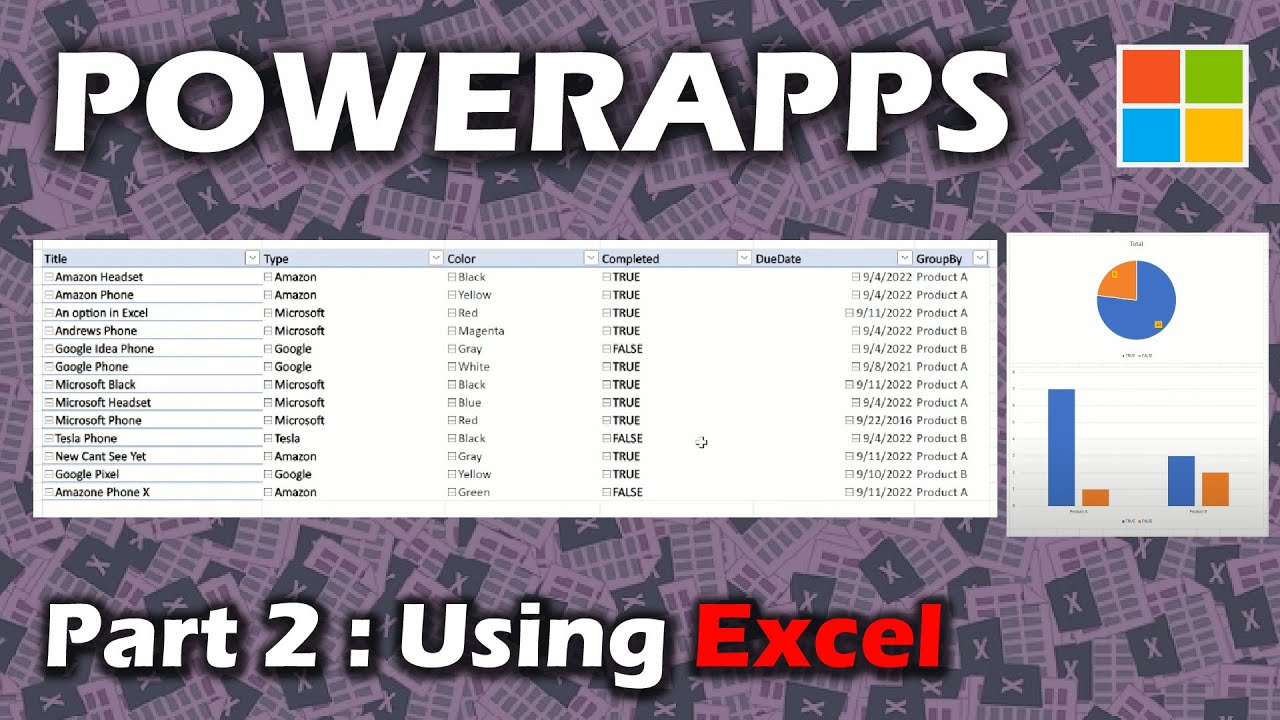
If you are going to use Excel as your backend with Power Apps you should use the strengths of Excel. In the end after creating filters and search I still believe the Power of Excel is the way to go. You can create slicers and charts which feed of Live data.
In this video we create filters, search, and collections in Power Apps. Then we use the capabilities of Excel to have slicers and charts which feed right off the backend data.
OnVisible Screen:
ClearCollect(colType,Distinct(Product,Type));Collect(colType,{Result:"All"});
Clear(colProduct);
ForAll(Product,Collect(colProduct,{Title:Title,Type:Type,Color:Color,Completed:Completed,DueDate:DueDate,GroupBy:GroupBy}));
Gallery Items:
If(drpType.Selected.Result="All",Filter(colProduct,StartsWith(Color,txtSearch.Text)),Filter(colProduct,Type=drpType.Selected.Result && StartsWith(Color,txtSearch.Text)))
**Note using a collection will only work with about 10k rows, you can create multiple collections though to increase the amount you can search.
Chapters:
0:00 Introduction
1:20 Learn UI from someone else first
2:50 Create collection with a "All" Option
6:25 Add a Search Text Box
9:35 Delegation Issue
11:30 Using Excel to Query and Form Data
14:00 Using Slicers on the PivotTable
15:20 Add Charts to your Excel
18:08 Use the Strengths of Excel
19:22 Conclusion
Tags and Topics
Browse our collection to discover more content in these categories.
Video Information
Views
16.4K
Likes
119
Duration
20:03
Published
Sep 12, 2022
User Reviews
4.2
(3) Related Trending Topics
LIVE TRENDSRelated trending topics. Click any trend to explore more videos.
No specific trending topics match this video yet.
Explore All Trends