Mastering Excel Sparklines: Quick & Easy Data Trend Visualization 📊
Discover how to create stunning sparklines in Excel with our simple step-by-step guide. Enhance your data analysis and make trends stand out effortlessly!
Mr. Devotor
2 views • Oct 7, 2024
About this video
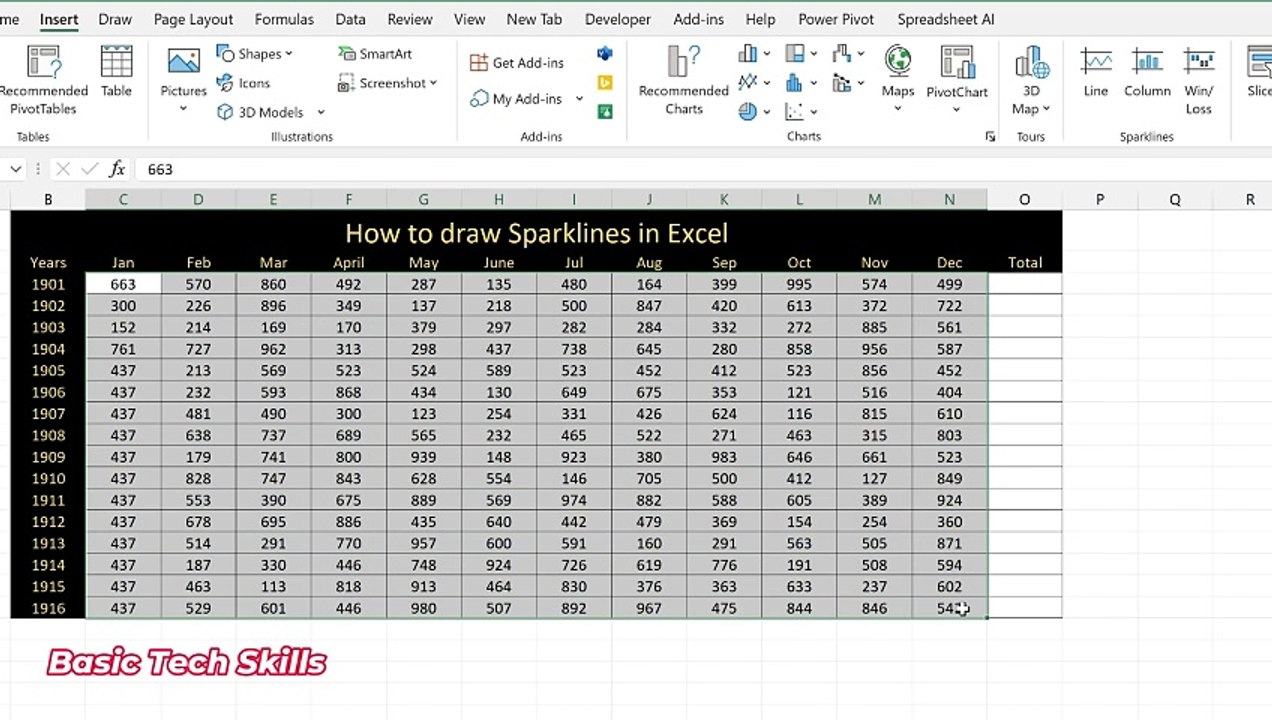
Learn how to draw sparklines in Excel like a pro with our easy-to-follow tutorial! Sparklines are an amazing way to visualize data trends directly within cells, making your spreadsheets more interactive and insightful. In this video, we break down the step-by-step process of creating sparklines in Excel, so even beginners can follow along effortlessly. Whether you're preparing a report, analyzing data, or simply looking to enhance your Excel skills, this guide will help you create compelling sparklines that stand out. Watch the full video to unlock the power of sparklines in your data presentation!<br /><br />With clear instructions and expert tips, you'll be able to use sparklines to highlight key trends and patterns in your data, improving your workflow and productivity. Excel doesn't have to be complicated, and we're here to prove it. Don't forget to like, comment, and subscribe for more Excel tips and tutorials!<br /><br />Hashtags #ExcelTips #Sparklines #ExcelTutorial #DataVisualization #HowToDrawSparklines #ExcelSkills #SpreadsheetTips #ExcelPro #DataAnalysis #Tutorial
Video Information
Views
2
Duration
0:59
Published
Oct 7, 2024
Related Trending Topics
LIVE TRENDSRelated trending topics. Click any trend to explore more videos.
No specific trending topics match this video yet.
Explore All Trends