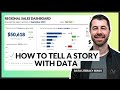
Master the Art of Data Storytelling: Dashboard Build Demo 📊
Discover how to craft compelling stories with data in this step-by-step dashboard building demonstration by Chris Dutton. Perfect for anyone aiming to communicate insights effectively!
Maven Analytics
309.0K views • Jul 10, 2024
About this video
In this video, Chris Dutton explains the framework for telling clear and effective stories with data, an important topic for anyone looking to improve their data literacy skills.
And if you liked this and want to see more, check out our FREE course…
DATA LITERACY FOUNDATIONS 👉 https://bit.ly/48FAvdQ
Hope to see you there!
Want to learn data analysis and business intelligence? Our guided learning model gives you the flexibility to create your perfect path, with live support and expert coaching to keep you on track every step of the way.
https://www.mavenanalytics.io/
Want to practice your skills? Explore and download sample datasets hand-picked by Maven instructors. Apply your data analysis and visualization skills to real-world data, from flight delays and movie ratings to shark attacks and UFO sightings.
https://www.mavenanalytics.io/data-playground
⏳ Timestamps ⏳
00:00 Introduction
00:24 Storytelling & Dashboard Design
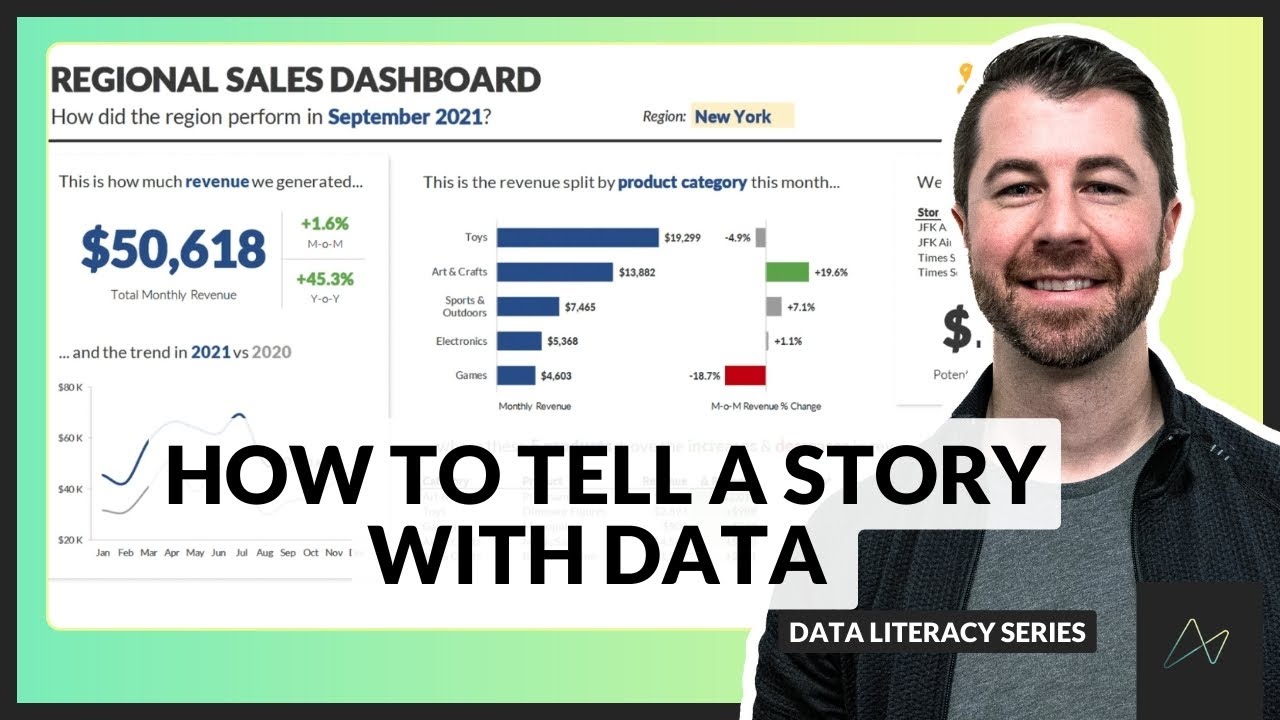
03:01 Case Study: Data Storytelling
04:02 Define the Purpose
05:00 Choose the Right Metrics
06:30 Present the Data Effectively
08:08 Eliminate Clutter & Noise
09:11 Use Layout to Focus Attention
11:53 Tell a Story
13:09 Data Literacy Foundations Free Course
And if you liked this and want to see more, check out our FREE course…
DATA LITERACY FOUNDATIONS 👉 https://bit.ly/48FAvdQ
Hope to see you there!
Want to learn data analysis and business intelligence? Our guided learning model gives you the flexibility to create your perfect path, with live support and expert coaching to keep you on track every step of the way.
https://www.mavenanalytics.io/
Want to practice your skills? Explore and download sample datasets hand-picked by Maven instructors. Apply your data analysis and visualization skills to real-world data, from flight delays and movie ratings to shark attacks and UFO sightings.
https://www.mavenanalytics.io/data-playground
⏳ Timestamps ⏳
00:00 Introduction
00:24 Storytelling & Dashboard Design
03:01 Case Study: Data Storytelling
04:02 Define the Purpose
05:00 Choose the Right Metrics
06:30 Present the Data Effectively
08:08 Eliminate Clutter & Noise
09:11 Use Layout to Focus Attention
11:53 Tell a Story
13:09 Data Literacy Foundations Free Course
Tags and Topics
Browse our collection to discover more content in these categories.
Video Information
Views
309.0K
Likes
11.5K
Duration
13:41
Published
Jul 10, 2024
User Reviews
4.7
(61) Related Trending Topics
LIVE TRENDSRelated trending topics. Click any trend to explore more videos.
No specific trending topics match this video yet.
Explore All Trends