Master Data Storytelling: Essential Skills for Aspiring Data Analysts 📊
Join our Winter 2025 mentorship program! Learn how to craft compelling data stories and think like a pro data analyst. Apply now: https://theanalyticsaccelerator.com/

Christine Jiang
31.2K views • Apr 9, 2025
About this video
MENTORSHIP - Applications for the Winter 2025 mentorship cohort are now open!
Apply here → https://theanalyticsaccelerator.com/
🎬 We’re looking for a video editor! → https://bit.ly/46gfaJP
If you (or someone you know) loves editing long-form educational YouTube content and want to work with me on videos that make a real impact, I’d love to hear from you!
ABOUT THIS VIDEO
Most analysts can make a chart. But making someone *care* about what that chart says? That’s the real flex.
In this video, we cover how to turn “just a graph” into a story that clicks with hiring managers, teammates, and stakeholders.
• A Tableau demo where I dig into business-relevant data and uncover the actual story behind the numbers
• Standout examples of data storytelling from my students
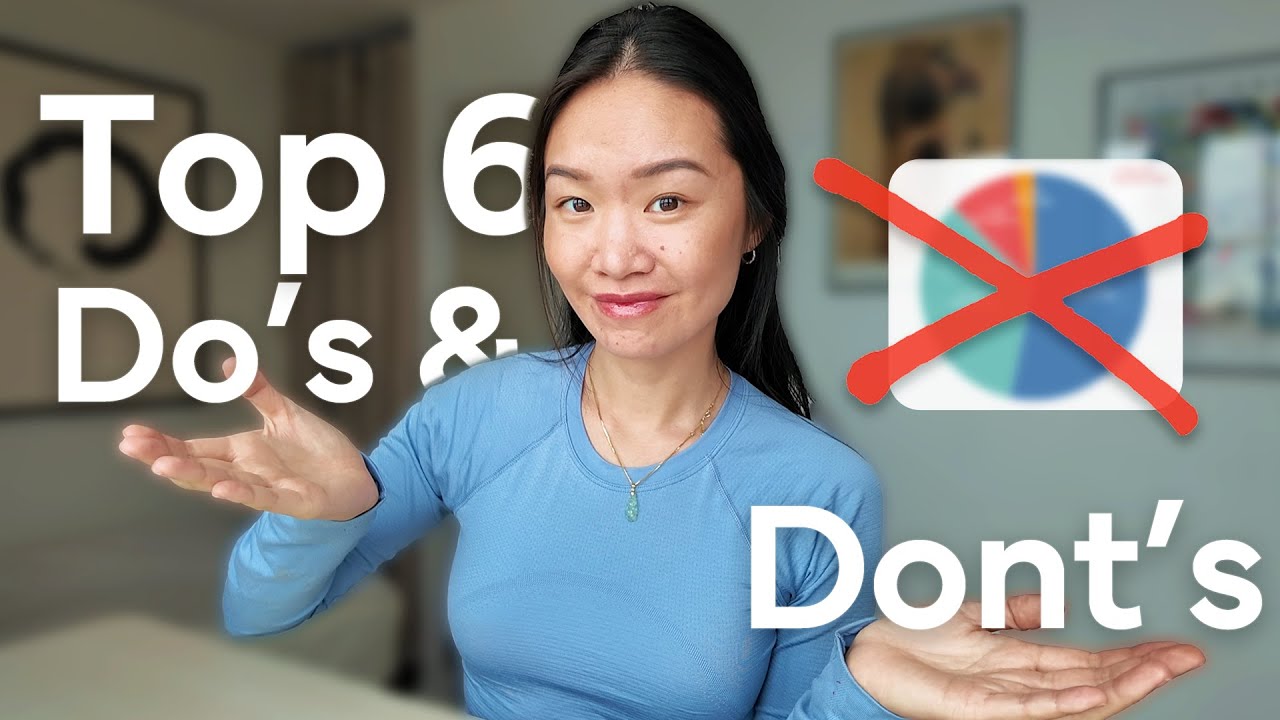
• Industry Do's and Don'ts of data storytelling (including why pie charts get you silently judged)
If your dashboards are saying too much - or nothing at all - this one’s for you.
ABOUT ME
If we haven’t met yet - hi! I’m Christine, a former data director and hiring manager helping ambitious career transitioners and recent grads land their first job as a data analyst. I'll be sharing the insights and strategies that empowered over 70% of job-hunting students in the first cohort of my mentorship program landed their first data job within 6 months, in today's super-competitive job market.
If you want to become a standout data analyst through applied business skills, soft skills, and strategies for every part of the job hunt process - so that you can have confidence, professional leverage, and bring real impact to work - connect below for more insights and future workshops!
LINKS
- Get more tips in my newsletter - https://bit.ly/3LodfYs
- Apply to the next cohort - https://theanalyticsaccelerator.com/
- Follow on LinkedIn - https://linkedin.com/in/christine-jiang
- Instagram - https://instagram.com/cjiaang (my photography, because why not)
Timestamps:
0:00 - Introduction
0:55 - Data Visualization vs. Data Storytelling
1:46 - Data Storytelling Demo
6:35 - Standout Student Examples
7:37 - Guidelines for Picking Visualizations
9:36 Storytelling Do's and Don'ts
Video URL:
Apply here → https://theanalyticsaccelerator.com/
🎬 We’re looking for a video editor! → https://bit.ly/46gfaJP
If you (or someone you know) loves editing long-form educational YouTube content and want to work with me on videos that make a real impact, I’d love to hear from you!
ABOUT THIS VIDEO
Most analysts can make a chart. But making someone *care* about what that chart says? That’s the real flex.
In this video, we cover how to turn “just a graph” into a story that clicks with hiring managers, teammates, and stakeholders.
• A Tableau demo where I dig into business-relevant data and uncover the actual story behind the numbers
• Standout examples of data storytelling from my students
• Industry Do's and Don'ts of data storytelling (including why pie charts get you silently judged)
If your dashboards are saying too much - or nothing at all - this one’s for you.
ABOUT ME
If we haven’t met yet - hi! I’m Christine, a former data director and hiring manager helping ambitious career transitioners and recent grads land their first job as a data analyst. I'll be sharing the insights and strategies that empowered over 70% of job-hunting students in the first cohort of my mentorship program landed their first data job within 6 months, in today's super-competitive job market.
If you want to become a standout data analyst through applied business skills, soft skills, and strategies for every part of the job hunt process - so that you can have confidence, professional leverage, and bring real impact to work - connect below for more insights and future workshops!
LINKS
- Get more tips in my newsletter - https://bit.ly/3LodfYs
- Apply to the next cohort - https://theanalyticsaccelerator.com/
- Follow on LinkedIn - https://linkedin.com/in/christine-jiang
- Instagram - https://instagram.com/cjiaang (my photography, because why not)
Timestamps:
0:00 - Introduction
0:55 - Data Visualization vs. Data Storytelling
1:46 - Data Storytelling Demo
6:35 - Standout Student Examples
7:37 - Guidelines for Picking Visualizations
9:36 Storytelling Do's and Don'ts
Video URL:
Video Information
Views
31.2K
Likes
1.4K
Duration
12:55
Published
Apr 9, 2025
User Reviews
4.6
(6) Related Trending Topics
LIVE TRENDSRelated trending topics. Click any trend to explore more videos.
No specific trending topics match this video yet.
Explore All Trends