Learn How to Create Line Graphs in Python with Matplotlib 📊 – Step-by-Step Tutorial
Discover how to easily create clear and professional line graphs in Python using Matplotlib. Perfect for beginners, this step-by-step guide will help you visualize your data effectively.
AI_Evolutionary Technology
3 views • Jul 27, 2025
About this video
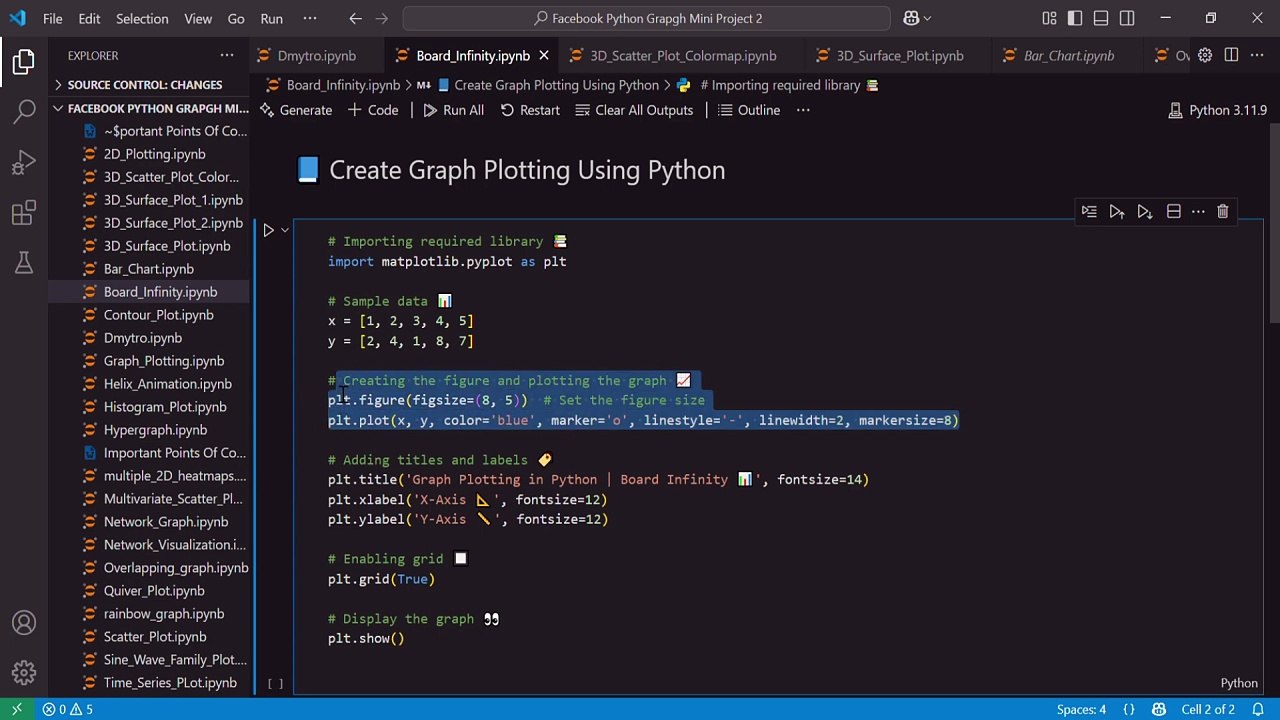
Create Line Graphs in Python with Matplotlib | Step-by-Step Tutorial<br />In this beginner-friendly Python tutorial, you’ll learn how to create a line graph using Matplotlib, a popular data visualization library. This step-by-step guide will walk you through everything—from importing the library to customizing your graph with titles, labels, colors, markers, and grids.<br /><br />📌 What’s covered in this video:<br /><br />Importing Matplotlib<br /><br />Plotting a simple line graph<br /><br />Customizing graph style (color, markers, size)<br /><br />Adding title and axis labels<br /><br />Enabling grid for better readability<br /><br />Whether you’re a Python beginner, student, or a data science enthusiast, this tutorial is perfect for learning how to visualize data effectively!<br /><br />🔔 Don’t forget to Like 👍, Comment 💬, and Subscribe 🔔 for more Python tutorials!<br /><br />#LineGraphPython #MatplotlibTutorial #PythonPlotting #PythonVisualization <br />#LearnPython #MatplotlibBeginner #GraphPlottingPython #PythonGraphs <br />#DataVisualizationPython #PythonForBeginners #CreateGraphsPython <br />#PythonMatplotlib #MatplotlibLineChart #StepByStepPython #BoardInfinity
Video Information
Views
3
Duration
1:09
Published
Jul 27, 2025
Related Trending Topics
LIVE TRENDSRelated trending topics. Click any trend to explore more videos.
No specific trending topics match this video yet.
Explore All Trends