Create Stunning Line Graphs in Excel: Easy Step-by-Step Guide 📊
Learn how to quickly and effortlessly make professional line graphs in Excel with our simple tutorial. Perfect for beginners and advanced users alike!
ENG-School
290 views • Oct 29, 2025
About this video
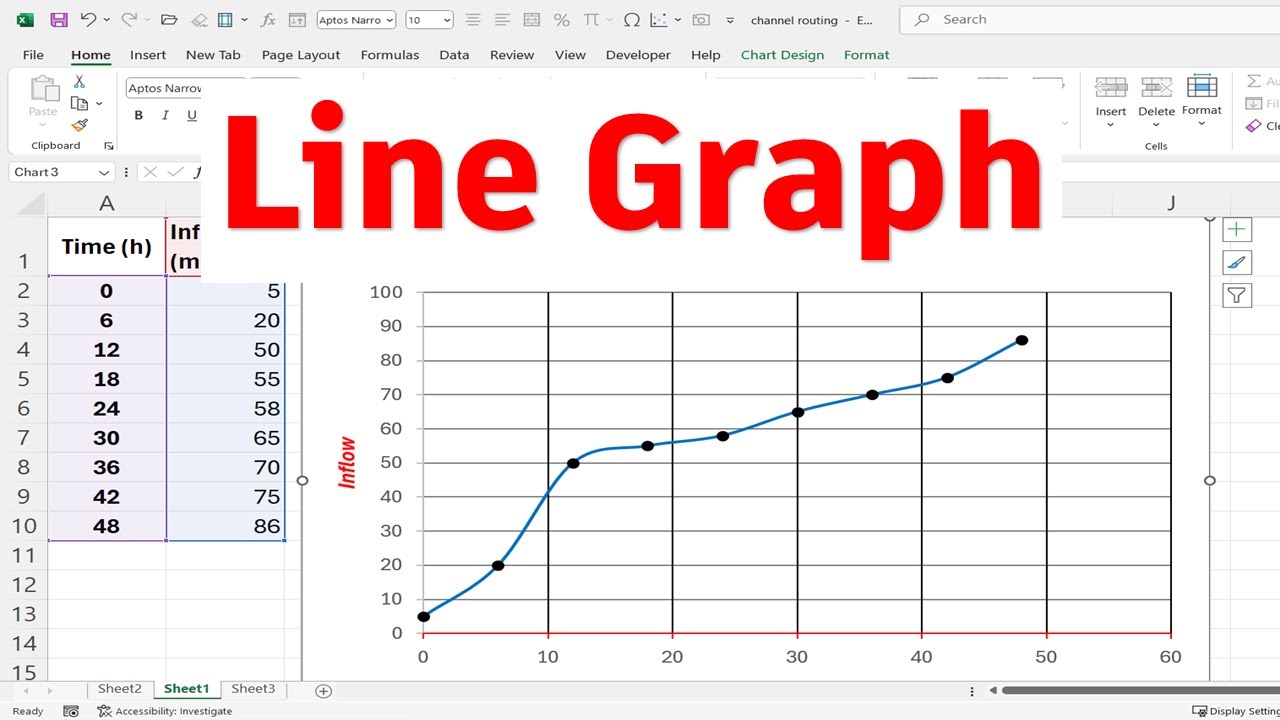
Ready to learn how to make a line graph in Excel — quickly and easily? In this step-by-step tutorial, I’ll show you how to create a clear and professional line chart using your data. Perfect for students, beginners, researchers, engineers, teachers, or anyone working with data in Excel.
You’ll learn:
How to enter and select your data
How to insert a line graph in Excel
How to format the graph (axes, labels, title, legend)
How to make your chart look clean and presentable
This method works in all versions of Excel (Microsoft Excel 2010, 2013, 2016, 2019, Excel 365).
By the end of the video, you’ll be able to create a line graph confidently and use it in reports, presentations, assignments, and projects.
Try it along with me! 😊
If this video helped you, don’t forget to Like, Subscribe, and Comment what tutorial you want next.
Keywords (Search-Friendly Terms):
line graph in excel tutorial, how to make a line chart, excel for beginners, excel graph tutorial, data visualization in excel, create a chart in excel, student excel help, excel assignment help, excel basics, Microsoft Excel chart guide, step-by-step excel lesson
Hashtags:
#ExcelTutorial #LineGraph #ExcelForBeginners #DataVisualization #MicrosoftExcel #ExcelTips #ExcelChart #StudentHelp #LearnExcel #Office365
Tags and Topics
Browse our collection to discover more content in these categories.
Video Information
Views
290
Likes
10
Duration
5:08
Published
Oct 29, 2025
Related Trending Topics
LIVE TRENDSRelated trending topics. Click any trend to explore more videos.
No specific trending topics match this video yet.
Explore All Trends