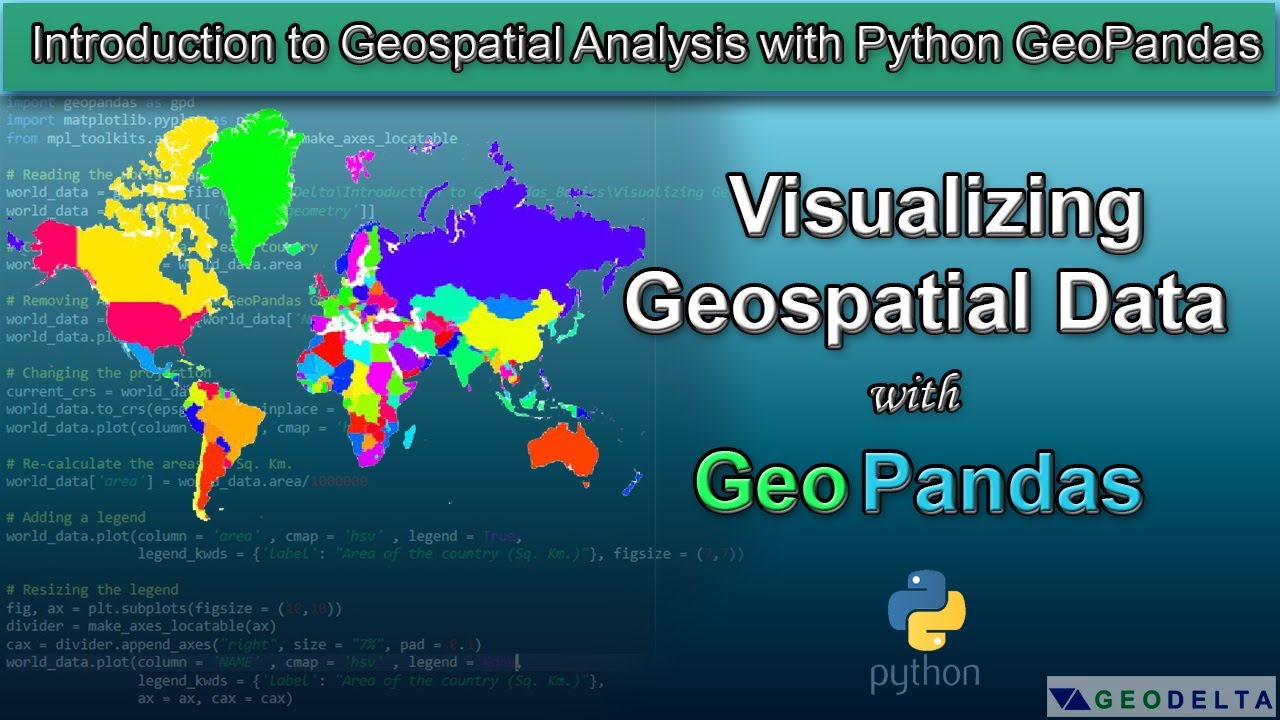
Introduction to Visualizing Geospatial Data with Python GeoPandas
In this tutorial, you will learn how to do basic plots of geospatial data using Geopandas and Matplotlib Python libraries. Download the exercise files - htt...
GeoDelta Labs
38.1K views • Mar 31, 2020
About this video
In this tutorial, you will learn how to do basic plots of geospatial data using Geopandas and Matplotlib Python libraries.
Download the exercise files - https://drive.google.com/open?id=1C_Zx4r-zRyc_9mNJ0XFZM4CDKuvtITaW
Tutorial on how to install Python and Configure Pandas (and Spyder IDE) - https://www.youtube.com/watch?v=YO6QgvgOz6U&t=198s
How to install GeoPandas (quick and easy) - https://youtu.be/310Es1ERf1M
Matplotlib Colormaps - https://matplotlib.org/users/colormaps.html
⭐NOTE:
‘Kite’ is an excellent tool that can help you boost your productivity when it comes to programming with its free Artificial Intelligence (AI) powered coding assistant. Kite is a plugin which provides smart completions and documentation as you’re typing-in your code, and its compatible with most of the well-known IDEs such as PyCharm, Spyder and VS Code. I absolutely love it, and recommend you guys to try it out as well.
https://www.kite.com/get-kite/?utm_medium=referral&utm_source=youtube&utm_campaign=geodelta&utm_content=description-only
Tags and Topics
Browse our collection to discover more content in these categories.
Video Information
Views
38.1K
Likes
594
Duration
28:29
Published
Mar 31, 2020
User Reviews
4.6
(7) Related Trending Topics
LIVE TRENDSRelated trending topics. Click any trend to explore more videos.
No specific trending topics match this video yet.
Explore All Trends