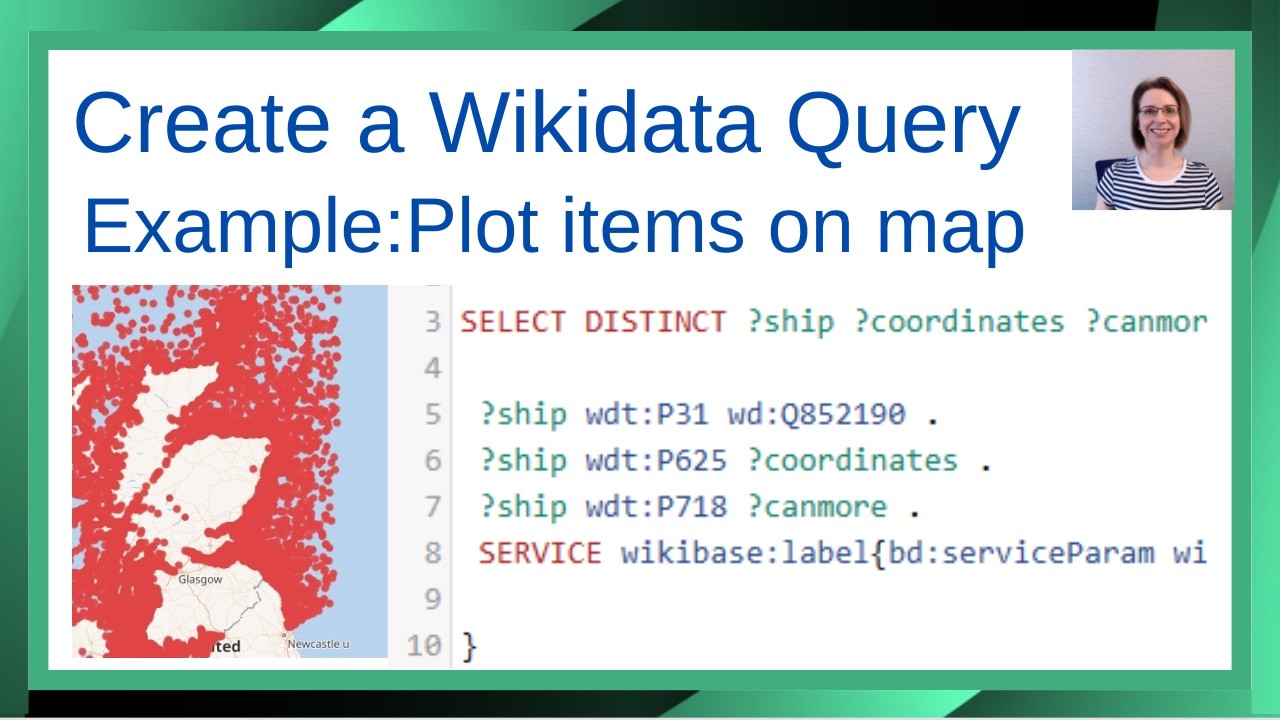
How to create a Wikidata Query using SPARQL- tutorial using Shipwrecks data
Learn how to extract and map Scottish shipwreck locations from Wikidata using SPARQL queries! 🎓This step-by-step tutorial shows you how to: ✅ Write a SPAR...

Data For Knowledge
1.5K views • Feb 24, 2022
About this video
Learn how to extract and map Scottish shipwreck locations from Wikidata using SPARQL queries!
🎓This step-by-step tutorial shows you how to:
✅ Write a SPARQL query to collect shipwreck data
✅Access coordinate locations and Canmore IDs
✅ Extract ship names using Wikidata labels
✅ Visualise 23,770+ shipwrecks on an interactive map
📩 Free Newsletter: Practical tips on Data, Tools, & Workflow - https://data-for-knowledge.kit.com/signup
Wikidata query created in the video can be found at https://w.wiki/4oVa.
Perfect for beginners learning Wikidata queries and data visualisation. This tutorial is part of a series - watch the follow-up videos to learn how to visualise this data in Power BI and R Shiny:
- Power BI for plotting on an esri map - https://youtu.be/WY28hpjWvhc
- R Shiny app for plotting on a OpenStreet map using leaflet - https://youtu.be/pasM4WkfM4A
⏱️ Time Stamps:
0:00 Introduction
0:51 Examining Wikidata Records
2:59 Using Wikidata Query Service
3:32 Writing SPARQL Query
5:22 Creating Shipwreck Instances
7:25 Create list of coordinates
9:42 Filtering for Canmore IDs
11:31 Adding Ship Names to Query
14:00 Remove the limit
14:31 Visualising Results on Map
15:10 Return to table view
15:21 Data Export Options
🔗Resources:
📚 Reading - Books from Amazon – https://amzn.to/4jVcnLa
📝 Organising my work with Clickup – https://try.web.clickup.com/8emh4z1sj9w6
Disclosure: I am a participant in the Amazon Services LLC Influencers/Associates program and a participant in the ClickUp Affiliate Program, and I may earn a commission if you click on my referral links and make a purchase. This disclosure is in compliance with the Federal Trade Commission's guidelines on endorsements and testimonials.
✍️ My articles on Medium - https://medium.com/@paulinecairns
The Canmore website mentioned in this video is part of Historic Environment Scotland - https://canmore.org.uk/
If you have used Wikidata location data in a project, I would be keen to hear in the comments below what you have used the data for.
The query in the video formed the basis of creating the R Script for this project https://community.powerbi.com/t5/R-Script-Showcase/Connecting-Wikidata-to-Power-BI-using-R/m-p/2008904 in Microsoft's Power BI community.
➡️ Suggested videos 👀
https://youtu.be/WY28hpjWvhc
https://youtu.be/pasM4WkfM4A
💡 Subscribe to the channel for more data tips, tricks, and tutorials! https://www.youtube.com/@DFK_data?sub_confirmation=1
☕ If this tutorial saved you a headache today, you can support the channel via a 'Thanks' or a coffee: https://buymeacoffee.com/dataforknowledge
👉 Follow me on LinkedIn: www.linkedin.com/in/pauline-cairns-data
#wikidata #wikidataquery #opendata #data #SPARQL #datavisualization #maritimehistory #scottishhistory #datavisualisation
Tags and Topics
Browse our collection to discover more content in these categories.
Video Information
Views
1.5K
Likes
57
Duration
16:02
Published
Feb 24, 2022
User Reviews
4.5
(1) Related Trending Topics
LIVE TRENDSRelated trending topics. Click any trend to explore more videos.
No specific trending topics match this video yet.
Explore All Trends