Create a Free One-Click Excel Dashboard with ChatGPT 😎
Learn how to build a quick, free Excel dashboard using ChatGPT and sales data in JSON format. Perfect for beginners!
Smart Minds Map
485 views • Jan 27, 2025
About this video
#exceldashboardstutorial #excelskills #excelforbeginners
👉 Prompt 1
This is the structure of my sales data in JSON format. Understand the structure and suggest five key data visualization metrics that would be the best fit to create an interactive sales dashboard. Also explain why we should use each one?
From the five key visualizations you suggested, change the second visualization metric to pie chart.
👉 Prompt 2
Now, I want you to create an interactive sales performance dashboard with the five key visualizations using HTML and JavaScript. Use the latest version of Plotly.js CDN and include an upload feature so that we can upload the JSON file. It should generate the dashboard based on the uploaded data.
Note: I need to upload the sales data from my local computer, and it should create the dashboard based on that data.
👉 Prompt 3
Provide this as an HTML downloadable file?
👉 Prompt 4
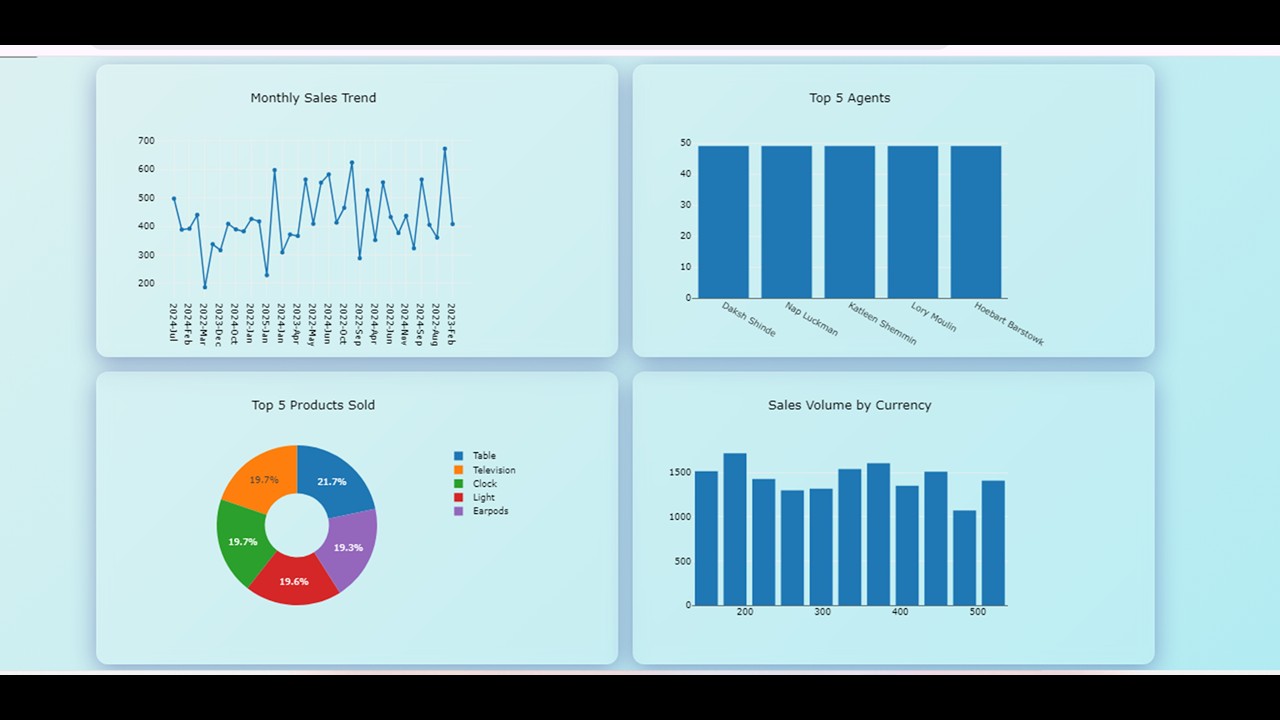
From the dashboard you created, change the style to glass morphism. Then, adjust the padding width of the charts to 40%, and change the background colour to icy blue. Can you also provide this as a downloadable HTML file?
❤️ Smartmindsap ➜ https://sites.google.com/view/smartmindsmap/home
🔥 Online Session Enrollment Link ➜ https://forms.gle/rE5TfQvAcF6BoE1a8
💡 Community Group ➜ https://chat.whatsapp.com/BTbXdWvkoNB4HTEFVK77WT
📌 Get New Video Updates ➜ https://www.youtube.com/channel/UCFfWl8e2Q8CiHcPq-XgUtwA
🎬 Table of Contents
00:00 Intro
01:02 Understanding Dataset
01:08 Converting CSV file to JSON file
01:23 Prompt 1 - Setting up ChatGPT node by sharing sample dataset
01:51 Prompt 2 - ChatGPT will suggest dashboard ideas.
02:21 Prompt 2.1 - Asking ChatGPT to make changes to chart types as per your requirements
02:31 Prompt 3 - Saving code as HTML file
03:03 Testing first cut of trail dashboard
03:12 Prompt 4 - Requesting for proper table formatting to visualization charts
03:29 Generating final finished dashboard with suggested formatting
03:46 Surprise elements and bonus tools for upskilling
In this video, you'll learn how to create an insightful and interactive Excel dashboard using the power of ChatGPT. We’ll walk you through each step, from organizing your data to creating key visualizations like charts and tables, all while using ChatGPT to assist in automating and streamlining the process. Whether you're a beginner or looking to enhance your Excel skills, this tutorial will guide you in building professional dashboards quickly and efficiently. Watch now and take your Excel game to the next level!
#ExcelDashboard #ChatGPT #ExcelTutorial #DataVisualization #ExcelTips #AIinExcel #DashboardCreation #ExcelForBeginners #ChatGPTforExcel #ExcelSkills #exceltutorial #microsoftexcel #exceltips #dataanalysis #excelformulas #productivityhacks #excelautomation #MsExcel #ExcelForBeginners #datavisualization #ExcelTricks #OfficeHacks #DataWonka #LearnExcel #ExcelHacks2025 #DataAnalytics #BusinessTips #worksmarter #CareerGrowth #XLOOKUP #masterexcel #exceltips #exceltutorial #dataanalytics
🎁 Tools & Discounts
🟡 📋 mockaroo | Practice dataset download | https://www.mockaroo.com/
🟡 📊 File Convertor | Convert csv to json | https://csvjson.com/csv2json
🟡 🔍 ChatGPT|Prompt|https://chatgpt.com/
💬 Follow & Chat with us 🙌
Instagram ➜ / https://www.instagram.com/datawonka/
Facebook ➜ / https://www.facebook.com/profile.php?id=100085898028975
Community ➜ / https://chat.whatsapp.com/BTbXdWvkoNB4HTEFVK77WT
👉 Prompt 1
This is the structure of my sales data in JSON format. Understand the structure and suggest five key data visualization metrics that would be the best fit to create an interactive sales dashboard. Also explain why we should use each one?
From the five key visualizations you suggested, change the second visualization metric to pie chart.
👉 Prompt 2
Now, I want you to create an interactive sales performance dashboard with the five key visualizations using HTML and JavaScript. Use the latest version of Plotly.js CDN and include an upload feature so that we can upload the JSON file. It should generate the dashboard based on the uploaded data.
Note: I need to upload the sales data from my local computer, and it should create the dashboard based on that data.
👉 Prompt 3
Provide this as an HTML downloadable file?
👉 Prompt 4
From the dashboard you created, change the style to glass morphism. Then, adjust the padding width of the charts to 40%, and change the background colour to icy blue. Can you also provide this as a downloadable HTML file?
❤️ Smartmindsap ➜ https://sites.google.com/view/smartmindsmap/home
🔥 Online Session Enrollment Link ➜ https://forms.gle/rE5TfQvAcF6BoE1a8
💡 Community Group ➜ https://chat.whatsapp.com/BTbXdWvkoNB4HTEFVK77WT
📌 Get New Video Updates ➜ https://www.youtube.com/channel/UCFfWl8e2Q8CiHcPq-XgUtwA
🎬 Table of Contents
00:00 Intro
01:02 Understanding Dataset
01:08 Converting CSV file to JSON file
01:23 Prompt 1 - Setting up ChatGPT node by sharing sample dataset
01:51 Prompt 2 - ChatGPT will suggest dashboard ideas.
02:21 Prompt 2.1 - Asking ChatGPT to make changes to chart types as per your requirements
02:31 Prompt 3 - Saving code as HTML file
03:03 Testing first cut of trail dashboard
03:12 Prompt 4 - Requesting for proper table formatting to visualization charts
03:29 Generating final finished dashboard with suggested formatting
03:46 Surprise elements and bonus tools for upskilling
In this video, you'll learn how to create an insightful and interactive Excel dashboard using the power of ChatGPT. We’ll walk you through each step, from organizing your data to creating key visualizations like charts and tables, all while using ChatGPT to assist in automating and streamlining the process. Whether you're a beginner or looking to enhance your Excel skills, this tutorial will guide you in building professional dashboards quickly and efficiently. Watch now and take your Excel game to the next level!
#ExcelDashboard #ChatGPT #ExcelTutorial #DataVisualization #ExcelTips #AIinExcel #DashboardCreation #ExcelForBeginners #ChatGPTforExcel #ExcelSkills #exceltutorial #microsoftexcel #exceltips #dataanalysis #excelformulas #productivityhacks #excelautomation #MsExcel #ExcelForBeginners #datavisualization #ExcelTricks #OfficeHacks #DataWonka #LearnExcel #ExcelHacks2025 #DataAnalytics #BusinessTips #worksmarter #CareerGrowth #XLOOKUP #masterexcel #exceltips #exceltutorial #dataanalytics
🎁 Tools & Discounts
🟡 📋 mockaroo | Practice dataset download | https://www.mockaroo.com/
🟡 📊 File Convertor | Convert csv to json | https://csvjson.com/csv2json
🟡 🔍 ChatGPT|Prompt|https://chatgpt.com/
💬 Follow & Chat with us 🙌
Instagram ➜ / https://www.instagram.com/datawonka/
Facebook ➜ / https://www.facebook.com/profile.php?id=100085898028975
Community ➜ / https://chat.whatsapp.com/BTbXdWvkoNB4HTEFVK77WT
Tags and Topics
Browse our collection to discover more content in these categories.
Video Information
Views
485
Likes
8
Duration
4:10
Published
Jan 27, 2025
Related Trending Topics
LIVE TRENDSRelated trending topics. Click any trend to explore more videos.
No specific trending topics match this video yet.
Explore All Trends