Graphing Linear Equations Using Tables of Values
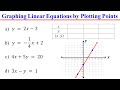
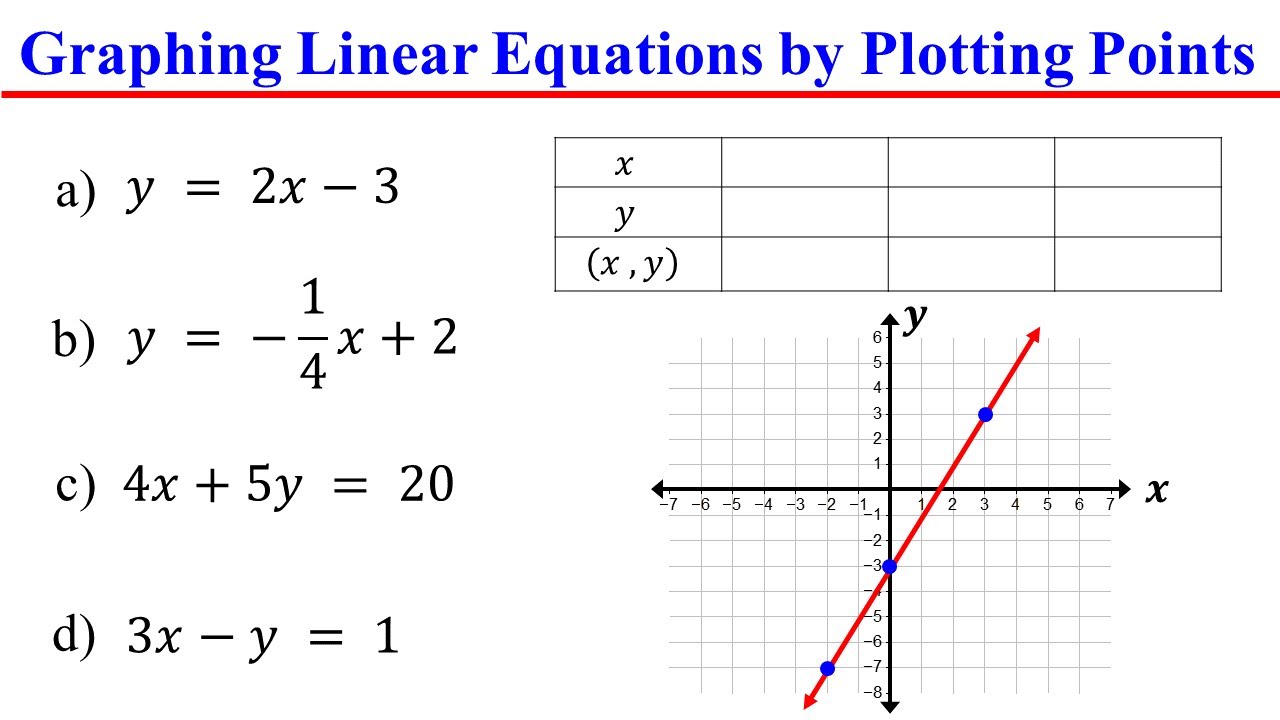
This algebra video demonstrates how to graph a linear equation by plotting points obtained from a table of values.
GoTutor Math
41.0K views • Aug 25, 2024
About this video
This algebra math video explains how to graph a linear equation by plotting points also know as using a table of values.
how to graph a linear equation by plotting points, how to graph a linear equation using a table of values, how graph linear equations in slope intercept form, how graph linear equations in standard form, how graph linear equations with fractions, linear equations, ged math, gcse math, sat math,
How to Graph Horizontal and Vertical Lines https://youtu.be/IaChXfv2Oes
How to plot a point on a coordinate plane https://youtu.be/5oGFVc7Dbn8
How to Determine Whether an Ordered Pair is a Solution to a Linear Equation in Two Variables https://youtu.be/640cW72kYRo
How to Determine Whether a Point is on a Line given a Linear Equation https://youtu.be/z9wdpFePMOo
How to Complete a Table of Solutions to a Linear Equation in Two Variables https://youtu.be/3gpScyGw08Y
How to Find Solutions to Linear Equations In Two Variables https://youtu.be/vvPLhF8474s
Tags and Topics
Browse our collection to discover more content in these categories.
Video Information
Views
41.0K
Likes
671
Duration
8:11
Published
Aug 25, 2024
User Reviews
4.7
(8) Related Trending Topics
LIVE TRENDSRelated trending topics. Click any trend to explore more videos.
No specific trending topics match this video yet.
Explore All Trends