Excel: Plot Line Graph with Error Bars 📊
Learn how to create a line graph with standard deviation error bars in Excel. A quick guide for better data visualization.

Laura Smith
234.4K views • Mar 18, 2021
About this video
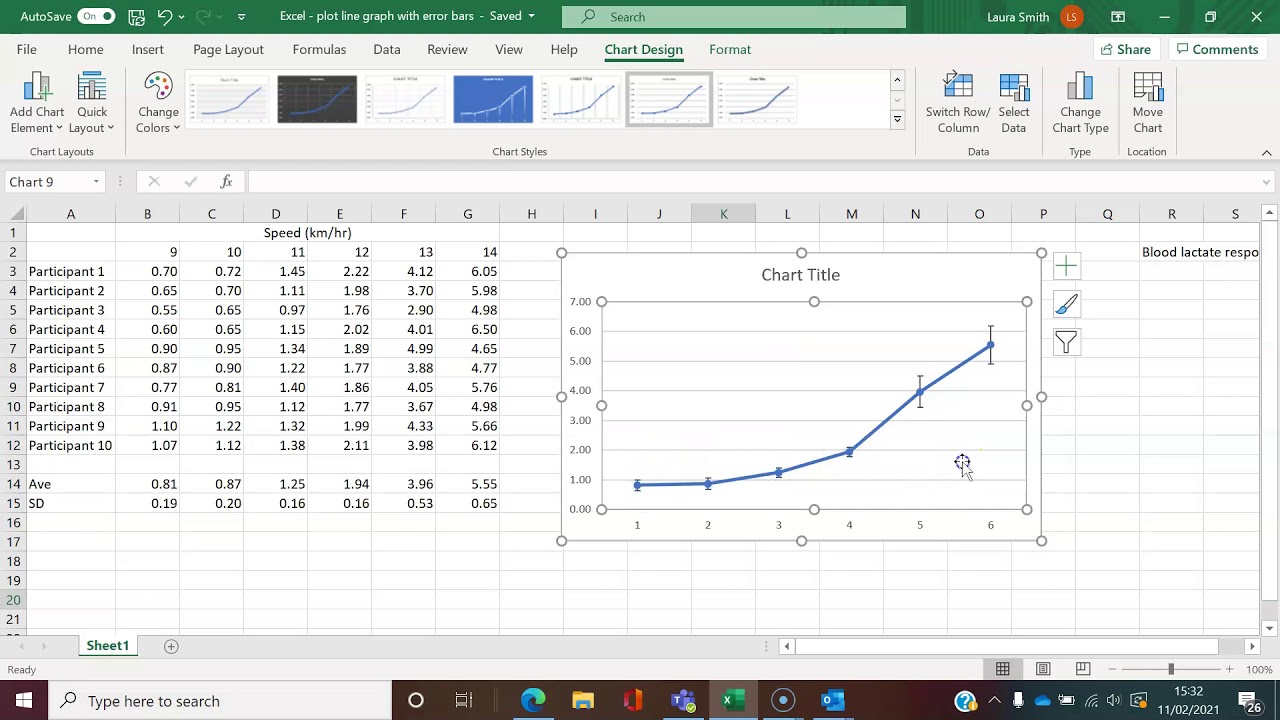
General Lab skill (Excel). This video will demonstrate how to plot a line graph with standard deviation presented as error bars. In the video the version of Excel used is within Microsoft 365.
Video Information
Views
234.4K
Likes
1.5K
Duration
6:12
Published
Mar 18, 2021
User Reviews
4.3
(46) Related Trending Topics
LIVE TRENDSRelated trending topics. Click any trend to explore more videos.
No specific trending topics match this video yet.
Explore All Trends