How to Create Stunning Step Histograms in Python with Matplotlib 🎨
Learn to craft eye-catching step histograms in Python using Matplotlib. Follow this easy tutorial to enhance your data visualizations and impress your audience!
AI_Evolutionary Technology
10 views • Jul 24, 2025
About this video
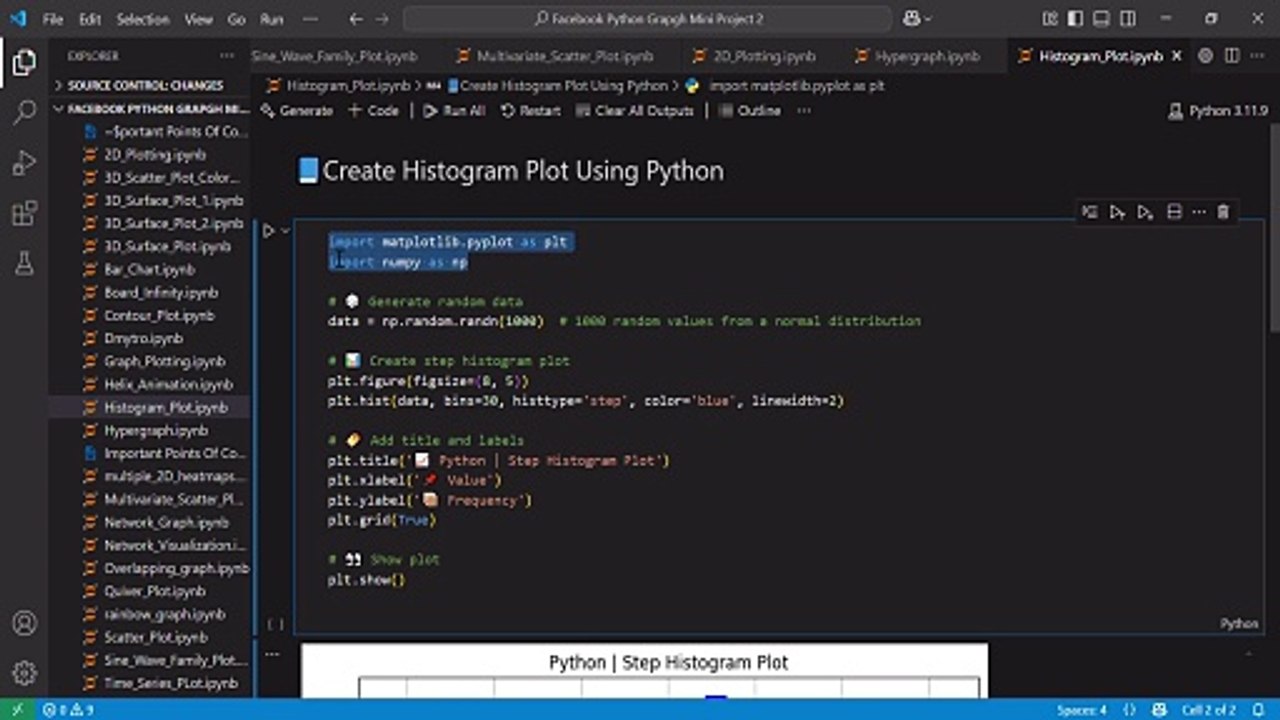
Create Beautiful Step Histograms with Python | Matplotlib Tutorial<br />In this tutorial, you’ll learn how to create a Step Histogram Plot using Python and Matplotlib. Step histograms are useful for visualizing the distribution of data in a clean, line-based style. We’ll walk through generating random data, customizing the histogram, and making your plots look professional.<br /><br />Whether you're a beginner in data visualization or looking to enhance your Python plotting skills, this video will guide you through the entire process.<br /><br />✅ What You'll Learn:<br /><br />How to use plt.hist() with histtype='step'<br /><br />Customizing bins, colors, and line width<br /><br />Adding titles, labels, and grid for clarity<br /><br />🔧 Tools Used:<br /><br />Python<br /><br />NumPy<br /><br />Matplotlib<br /><br />Don’t forget to like, comment, and subscribe for more Python tutorials!<br /><br />#python #matplotlib #stephistogrampython #histogramplotpython #matplotlibhistogram #pythondatavisualization #pythonplottingtutorial #stephisttype #createhistogrammatplotlib #matplotlibtutorial #pythonbeginnertutorial #datasciencepython #histogramexamplepython #pyplothiststep
Video Information
Views
10
Duration
1:05
Published
Jul 24, 2025
Related Trending Topics
LIVE TRENDSRelated trending topics. Click any trend to explore more videos.
No specific trending topics match this video yet.
Explore All Trends