Build a Dynamic Dashboard with Pivot Tables & Charts in Google Sheets (Step-by-Step Tutorial)
📌 Shop for Templates & Spreadsheets: https://www.mondaygoal.com 📌 Connect with me: https://mondaygoal.my.canva.site/ 📌 Color Pallet: https://www.canva.c...

MondayGoalGirl
2.5K views • Sep 22, 2025
About this video
📌 Shop for Templates & Spreadsheets: https://www.mondaygoal.com
📌 Connect with me: https://mondaygoal.my.canva.site/
📌 Color Pallet: https://www.canva.com/colors/color-meanings/baby-blue/
Want to make your data come alive? 🚀
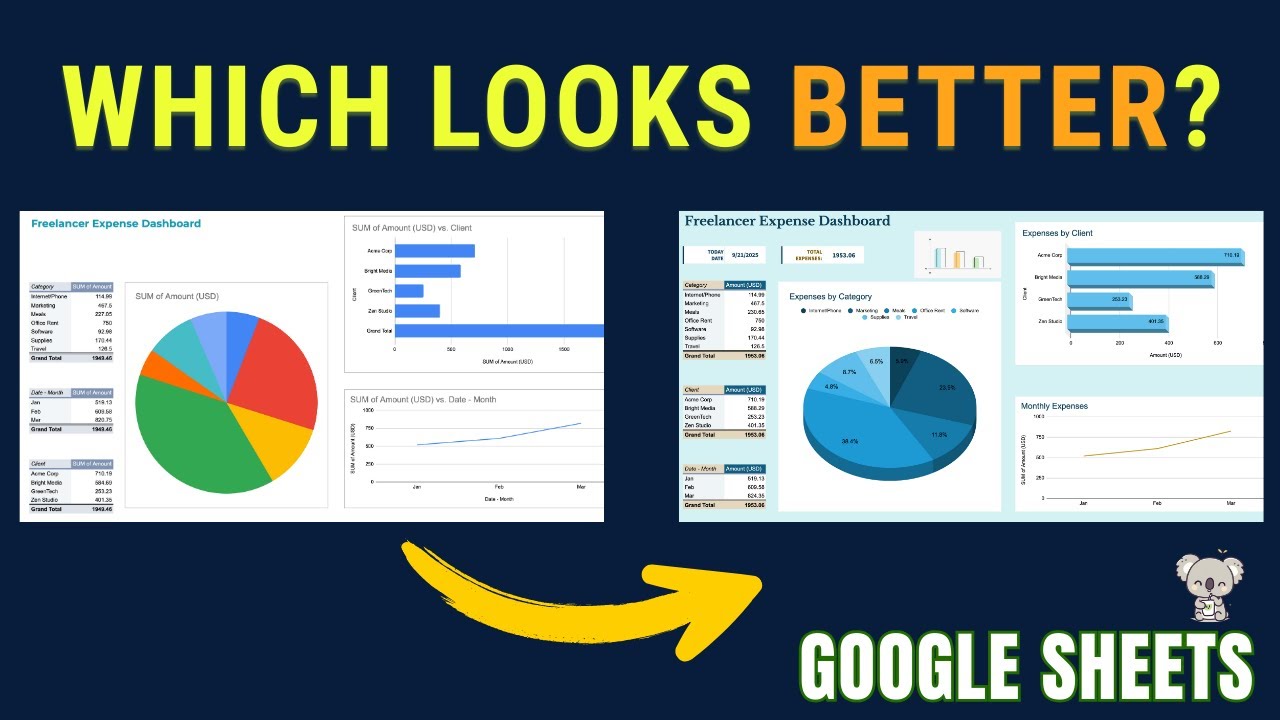
In this step-by-step tutorial, I’ll show you how to build a dynamic dashboard in Google Sheets using pivot tables and charts. By the end, you’ll know how to:
✅ Create pivot tables for categories, clients, and monthly expenses
✅ Build interactive charts (pie, bar, line)
✅ Apply color palettes to design a clean, professional dashboard
✅ Add totals and customize layout for the perfect look
This tutorial is beginner-friendly, so even if you’re new to Google Sheets, you’ll be able to follow along. Perfect for freelancers, small businesses, and anyone who wants to visualize their data easily.
0:00 – Intro: What we’ll build (Dynamic Dashboard in Google Sheets)
0:28 – Creating pivot table for expenses by category
1:16 – Creating pivot table for client expenses
1:45 – Creating pivot table for monthly expenses
2:38 – Building charts (Pie, Bar, Line)
3:08 – Customizing charts with color palettes & titles
6:46 – Adding totals and arranging dashboard layout
7:21 – Final dashboard review + design tips
8:20 – Outro & MONDAYGOAL.COM (channel + store)
📌 What you’ll learn:
How to insert pivot tables in Google Sheets
How to create charts (pie chart, bar chart, line chart)
How to customize dashboards with color themes
Tips for making your dashboard look professional
🔗 Check out my channel for more Google Sheets tutorials and free templates!
#GoogleSheets #Dashboard #PivotTables #charts
📌 Connect with me: https://mondaygoal.my.canva.site/
📌 Color Pallet: https://www.canva.com/colors/color-meanings/baby-blue/
Want to make your data come alive? 🚀
In this step-by-step tutorial, I’ll show you how to build a dynamic dashboard in Google Sheets using pivot tables and charts. By the end, you’ll know how to:
✅ Create pivot tables for categories, clients, and monthly expenses
✅ Build interactive charts (pie, bar, line)
✅ Apply color palettes to design a clean, professional dashboard
✅ Add totals and customize layout for the perfect look
This tutorial is beginner-friendly, so even if you’re new to Google Sheets, you’ll be able to follow along. Perfect for freelancers, small businesses, and anyone who wants to visualize their data easily.
0:00 – Intro: What we’ll build (Dynamic Dashboard in Google Sheets)
0:28 – Creating pivot table for expenses by category
1:16 – Creating pivot table for client expenses
1:45 – Creating pivot table for monthly expenses
2:38 – Building charts (Pie, Bar, Line)
3:08 – Customizing charts with color palettes & titles
6:46 – Adding totals and arranging dashboard layout
7:21 – Final dashboard review + design tips
8:20 – Outro & MONDAYGOAL.COM (channel + store)
📌 What you’ll learn:
How to insert pivot tables in Google Sheets
How to create charts (pie chart, bar chart, line chart)
How to customize dashboards with color themes
Tips for making your dashboard look professional
🔗 Check out my channel for more Google Sheets tutorials and free templates!
#GoogleSheets #Dashboard #PivotTables #charts
Tags and Topics
Browse our collection to discover more content in these categories.
Video Information
Views
2.5K
Likes
50
Duration
8:40
Published
Sep 22, 2025
User Reviews
4.5
(2) Related Trending Topics
LIVE TRENDSRelated trending topics. Click any trend to explore more videos.
Trending Now