10 Build a 10-Stock Portfolio in Excel: Efficient Frontier, Capital Market Line & More 📊
Learn how to create a 10-stock portfolio in Excel, including calculations for expected return, risk, variance-covariance matrix, and visualizing the efficient frontier, tangent line, and capital market line for optimal investment analysis.
Ahscholars
1.5K views • Nov 13, 2023
About this video
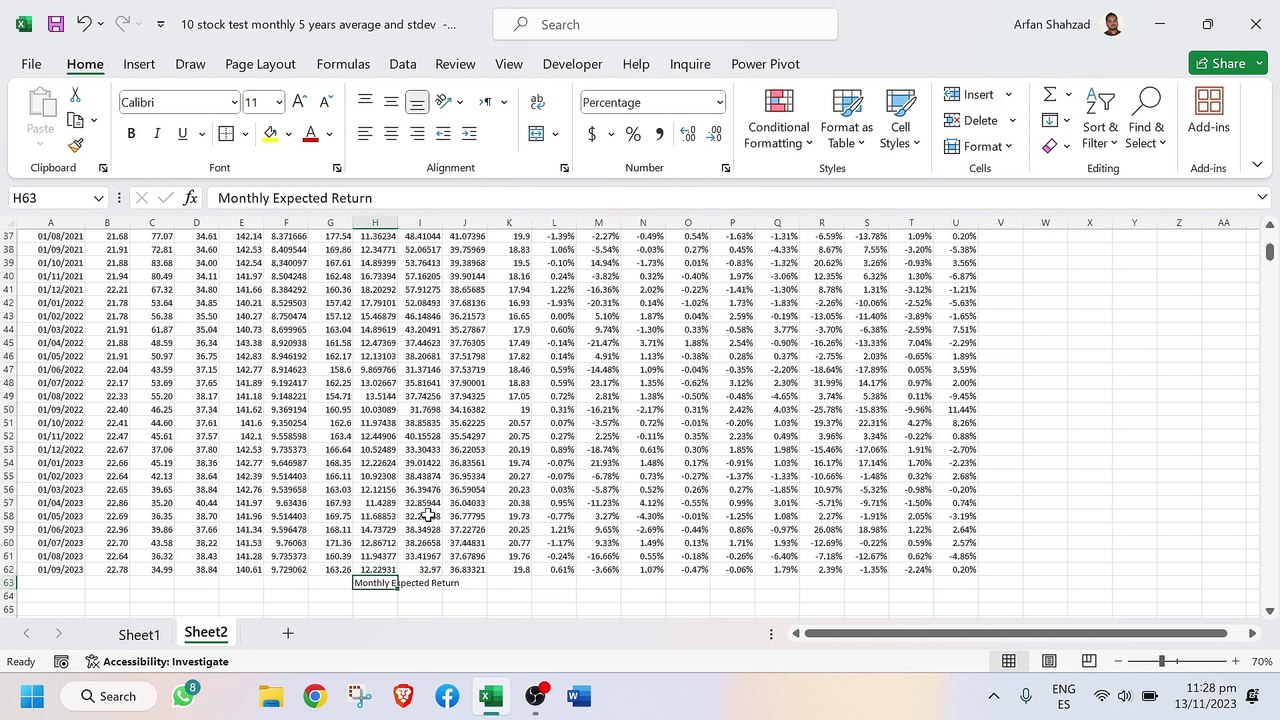
A complete process of building ten stock portfolio in excel <br />Creating an Excel spreadsheet with an efficient frontier, tangent line, capital market line, and portfolio statistics involves several steps. I'll provide a general outline for each section, but keep in mind that you may need to adapt the details based on your specific data and preferences.<br /><br />Excel Spreadsheet Outline:<br />1. Stock Data:<br />Create a table with historical stock prices for the 10 stocks in your portfolio.<br />Include columns for each stock's daily or periodic returns.<br />2. Portfolio Weights:<br />Allocate weights to each stock in your portfolio. Ensure the weights sum up to 1.<br />3. Portfolio Returns:<br />Calculate the expected return of the portfolio using the weighted average of individual stock returns.<br />4. Portfolio Standard Deviation:<br />Calculate the standard deviation of the portfolio returns using the formula for portfolio variance.<br />5. Efficient Frontier:<br />Create a scatter plot of various portfolios with different combinations of expected return and standard deviation.<br />Highlight the portfolios that make up the efficient frontier.<br />6. Tangent Line:<br />Identify the tangent line that touches the efficient frontier at the point where the Sharpe ratio is maximized.<br />Calculate the slope of the tangent line using the formula: (Rp - Rf) / σp, where Rp is the portfolio return, Rf is the risk-free rate, and σp is the portfolio standard deviation.<br />7. Capital Market Line (CML):<br />Plot the Capital Market Line by combining the risk-free rate and the tangent portfolio.<br />The CML equation is: CML: E(Rp) = Rf + [ (E(Rm) - Rf) / σm ] * σp, where E(Rp) is the expected return of the portfolio, Rf is the risk-free rate, E(Rm) is the expected return of the market portfolio, σm is the standard deviation of the market portfolio, and σp is the standard deviation of the portfolio.<br />8. YouTube Title, Description, and Tags:
Video Information
Views
1.5K
Duration
51:10
Published
Nov 13, 2023
User Reviews
3.7
(1) Related Trending Topics
LIVE TRENDSRelated trending topics. Click any trend to explore more videos.
Trending Now