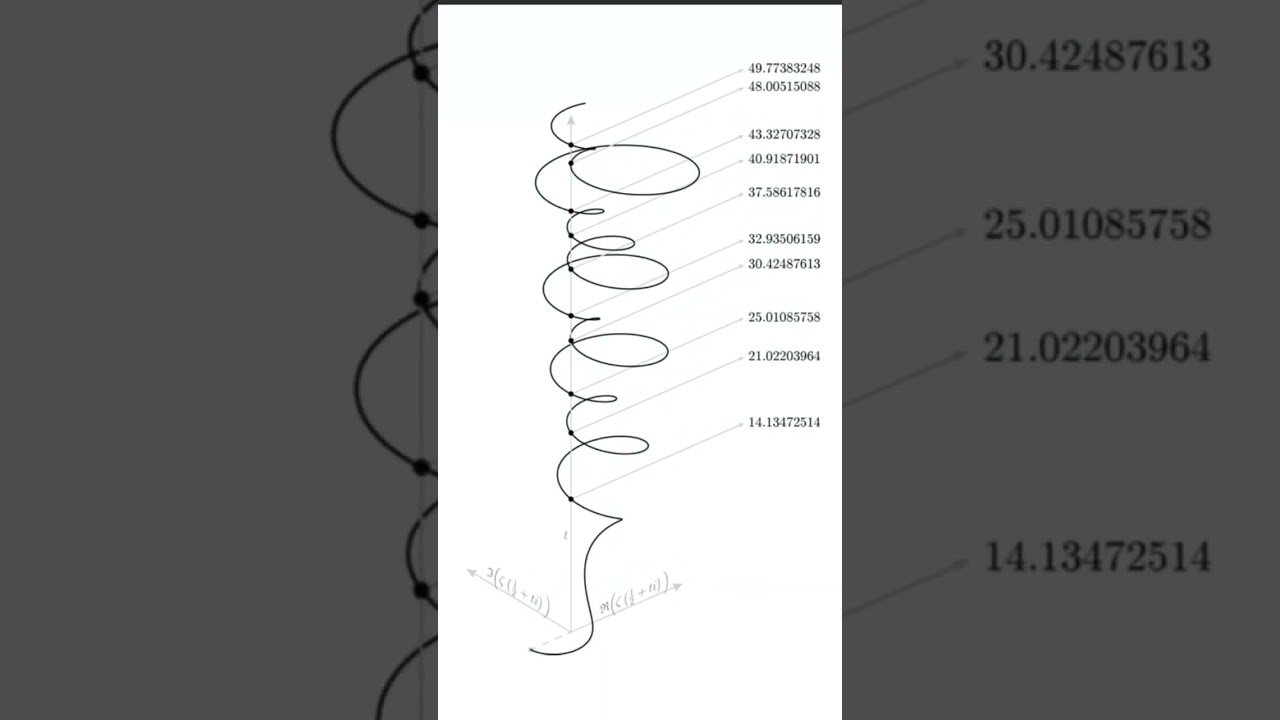
Visualizing the Riemann Zeta Function: Spiral Plot on the Critical Line 🔍
Explore a captivating spiral parametric plot of the Riemann zeta function along the critical line, revealing intriguing patterns and insights into one of mathematics' greatest mysteries.
Math&physics
3.3K views • Feb 9, 2024
Video Information
Views
3.3K
Likes
28
Duration
0:04
Published
Feb 9, 2024
User Reviews
4.2
(3) Related Trending Topics
LIVE TRENDSRelated trending topics. Click any trend to explore more videos.
No specific trending topics match this video yet.
Explore All Trends