Time Series Analysis: X-Axis in Math & Stats 📊
Learn the basics of time series analysis and what the x-axis represents in graphs for 12th-grade Math & Statistics.

VedSquare
8 views • Jun 23, 2025
About this video
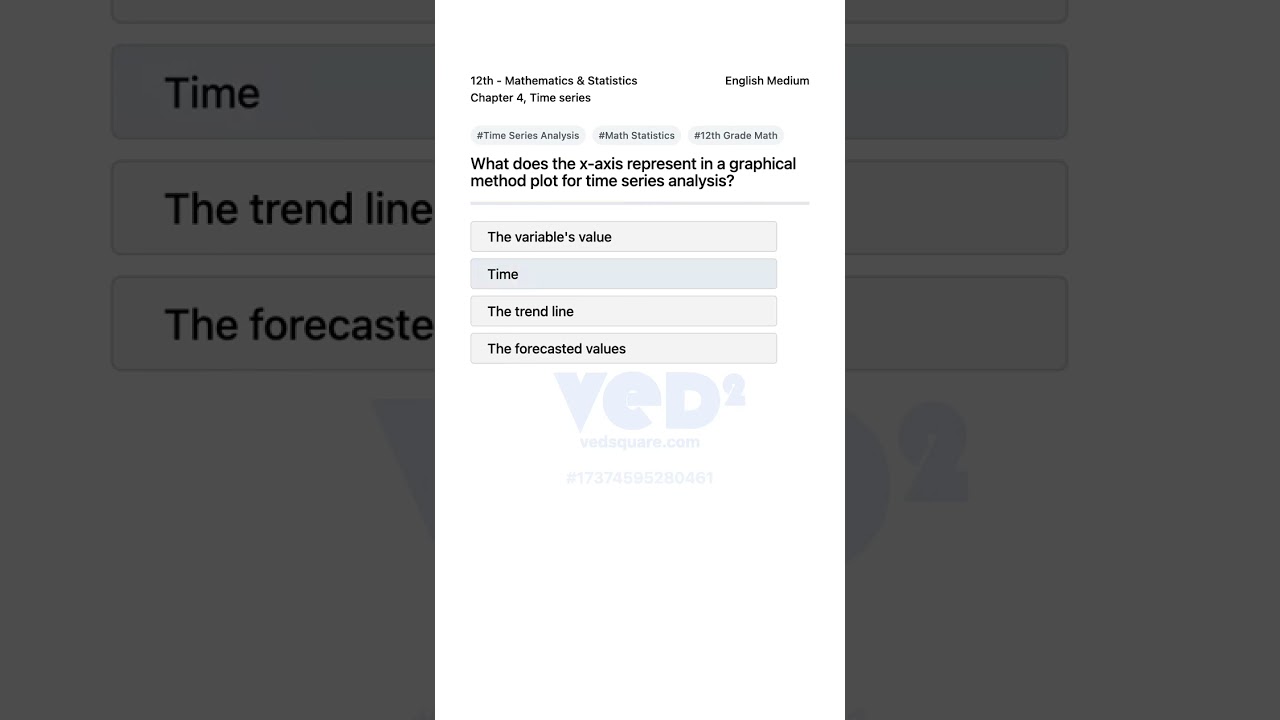
Dive into the basics of time series analysis in Mathematics & Statistics for 12th grade. This short explains what the x-axis represents in a graphical method plot for time series analysis. The question addressed is: What does the x-axis represent in a graphical method plot for time series analysis? Options include The variable's value, Time, The trend line, and The forecasted values. Discover why Time is the correct answer and how it helps in understanding trends and patterns over specific periods. Perfect for students looking to strengthen their grasp on time series analysis and graphical interpretations in math statistics.
Standard: 12th
Subject: Mathematics & Statistics
Medium: English
Chapter: Time series
Chapter Number: 4
Book Page: 57
Difficulty: easy
17374595280461
Standard: 12th
Subject: Mathematics & Statistics
Medium: English
Chapter: Time series
Chapter Number: 4
Book Page: 57
Difficulty: easy
17374595280461
Tags and Topics
Browse our collection to discover more content in these categories.
Video Information
Views
8
Duration
0:28
Published
Jun 23, 2025
Related Trending Topics
LIVE TRENDSRelated trending topics. Click any trend to explore more videos.
No specific trending topics match this video yet.
Explore All Trends