Understanding Population Dynamics and Virus Spread with 1D Maps 📊
Explore how simple 1D maps can help us model population changes and virus transmission over time, making complex processes easier to understand.
Andrea Idini
1.4K views • Mar 25, 2020
About this video
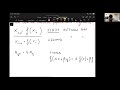
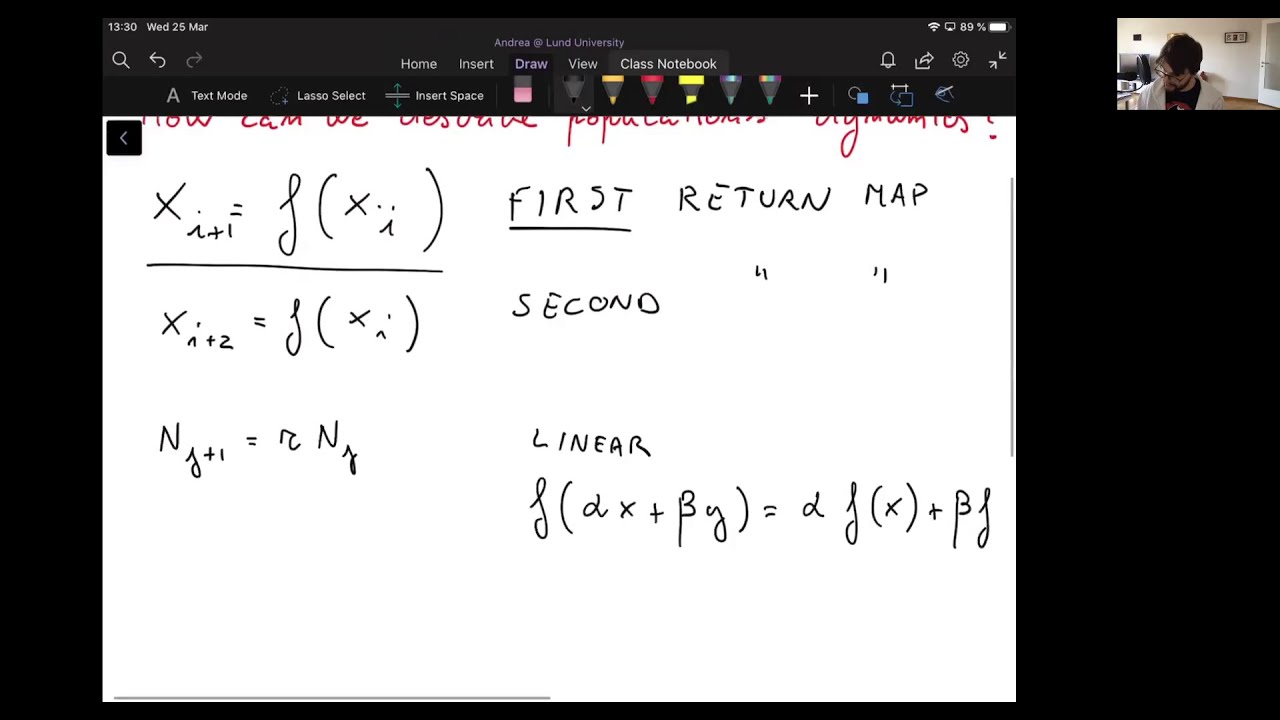
How can we describe the number of individuals in a population year by year in a simple way? How can we describe the spread of a virus?
Here it comes an easy concept: maps. That is the description of a system in discrete time-steps, and the evolution of the state of the system at a given step exclusively in function of the previous step. These are the return maps.
One of the most famous return maps is the logistic map.
In this lecture we explain the basics mathematics behind maps and how to find and characterise fixed points.
--------------------
These are recordings of the course of Chaos for science and technology at Lund University FMFN05. The course aims at giving an introduction to chaotic systems, i.e. non-linear systems that are deterministic but with a time development which is not predictable over longer periods. The course should give a possibility to reflect over the fascinating phenomena which may show up in chaotic systems, with examples from biology and physics.
Other sources:
Logistic map simulation applet: http://rocs.hu-berlin.de/D3/logistic/
Veritasium video on logistic map: https://youtu.be/ovJcsL7vyrk
Modern on Caos and maps: https://arxiv.org/pdf/nlin/0308023.pdf
GitHub: https://www.github.com/lundinchaos
Lecturer is Andrea Idini: http://matfys.lth.se/staff/andrea.idini/
Video Information
Views
1.4K
Duration
01:31:50
Published
Mar 25, 2020
User Reviews
3.7
(1) Related Trending Topics
LIVE TRENDSRelated trending topics. Click any trend to explore more videos.
No specific trending topics match this video yet.
Explore All Trends