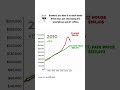
U.S. House Prices vs Inflation (1980–2025) 📈 #housingmarket #buyingahome #realincome
This chart compares U.S. House Prices vs Inflation (1980–2025). The calculation starts with an average house price of $50,000 in 1980. The House Price line...
DataCandle
17.4K views • Sep 3, 2025
About this video
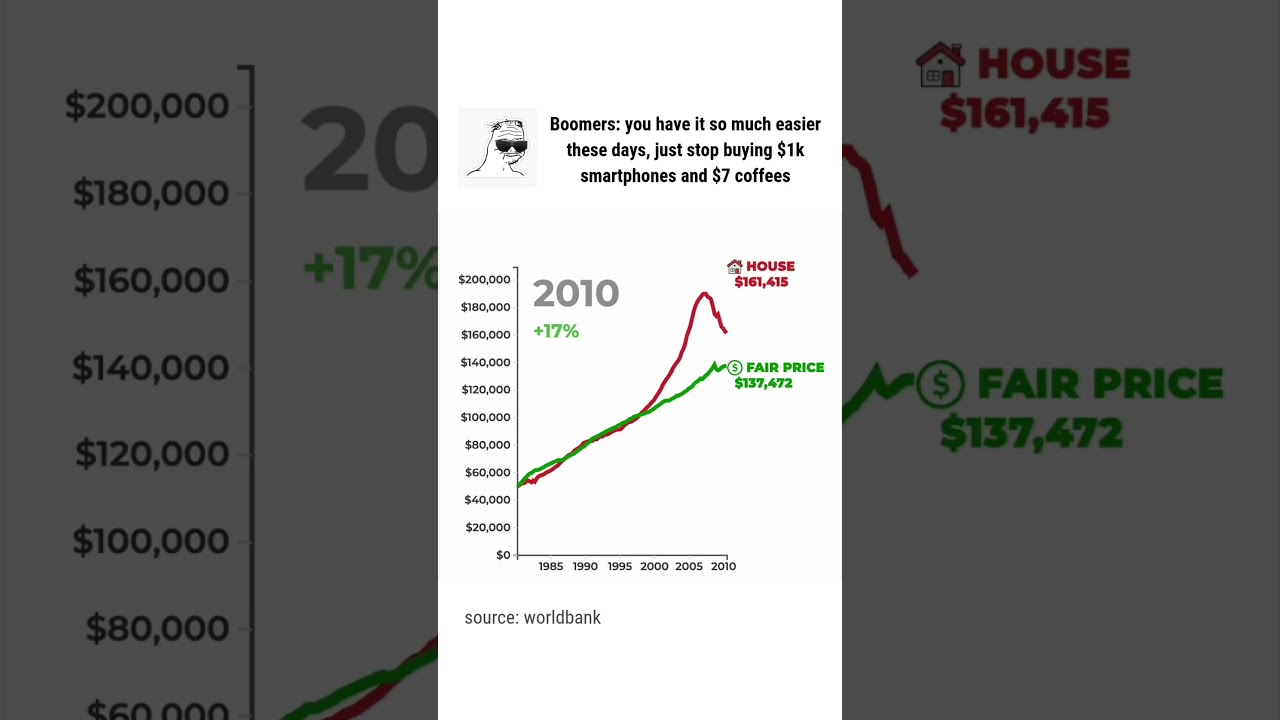
This chart compares U.S. House Prices vs Inflation (1980–2025).
The calculation starts with an average house price of $50,000 in 1980.
The House Price line is based on the U.S. House Price Index, showing how real estate values developed over time.
The Fair Price line is adjusted using the U.S. Consumer Price Index (CPI), showing what the same house should cost today if it had only tracked general consumer inflation.
This side-by-side view highlights the long-term divergence between actual housing prices and the broader inflation trend.
#RealEstate #Inflation #USeconomy #HousePrices #CPI #USA
Video Information
Views
17.4K
Likes
56
Duration
0:17
Published
Sep 3, 2025
User Reviews
4.0
(3) Related Trending Topics
LIVE TRENDSRelated trending topics. Click any trend to explore more videos.