Step-by-Step Guide to Sketching Any Polynomial Function Graph
Learn a straightforward process to accurately sketch the graph of any polynomial function. This video covers essential steps, including analyzing key features of the polynomial.

Math By The Pixel
75.6K views • Oct 22, 2024
About this video
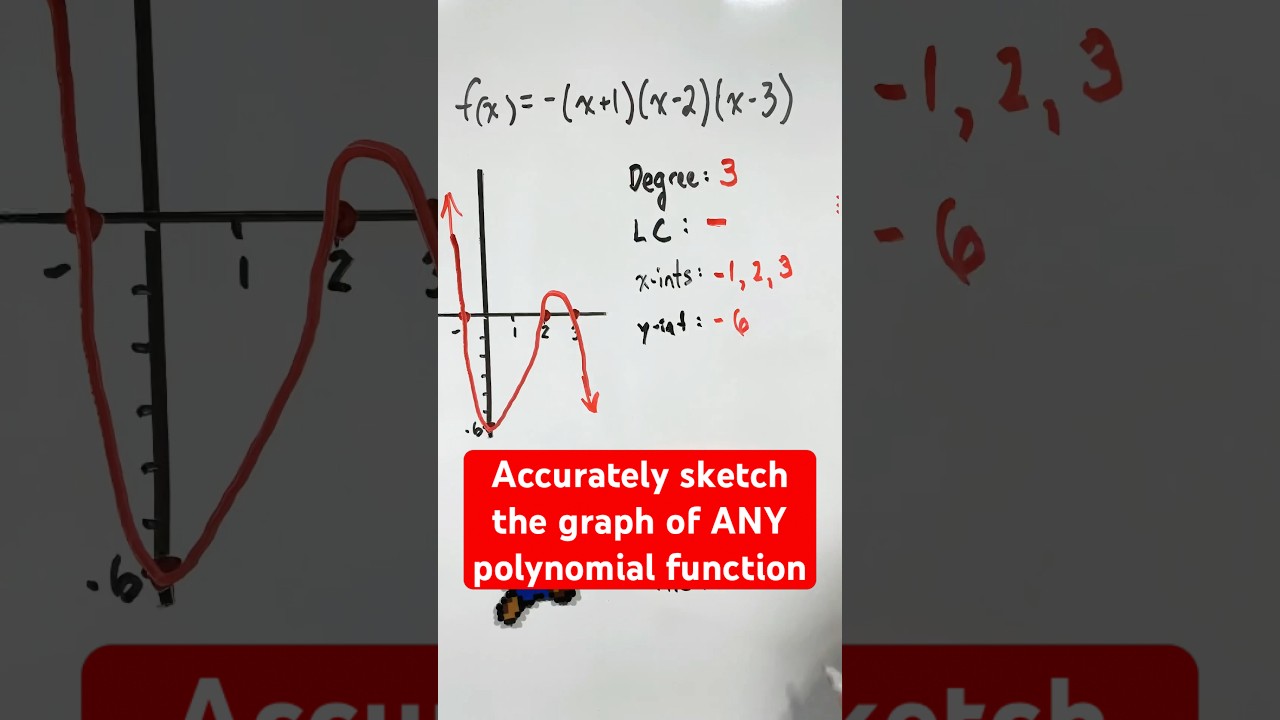
In this video I will walk you through a simple process that can be used to accurately sketch the graph of ANY polynomial function.
We begin by determining the degree of the given polynomial function. Upon examination, we see that we are working with a cubic function since there are three x terms being multiplied. This tells us that the degree of the polynomial function will be 3.
The next step is to analyze the leading coefficient of the polynomial. We can see that we are dealing with a negative leading coefficient. This tells us that the end behavior of the polynomial function is Q2 to Q4.
From there, we identify the x-intercepts, the y-intercept, and the order of the x-intercepts. After plotting these key pieces of information, we join everything with a smooth curve to create the graph of the polynomial function.
#shorts
Tags and Topics
Browse our collection to discover more content in these categories.
Video Information
Views
75.6K
Likes
1.4K
Duration
0:11
Published
Oct 22, 2024
User Reviews
4.7
(15) Related Trending Topics
LIVE TRENDSRelated trending topics. Click any trend to explore more videos.
Trending Now