Shade Area Between Lines in Excel Chart 📊
Learn how to shade the space between two lines in an Excel chart for clearer data comparison.
Computergaga
149.8K views • May 11, 2020
About this video
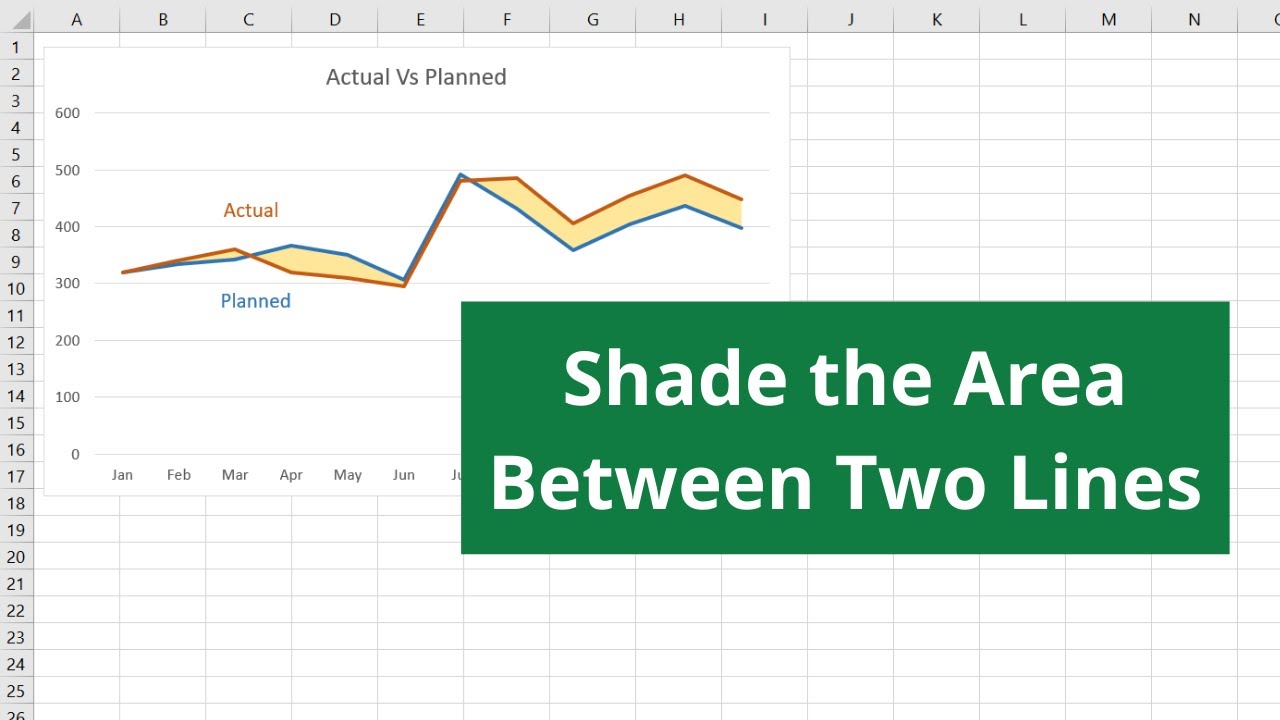
In this video, we shade the area between two lines of a line chart to visualise the difference clearer.
There are many reasons to colour this area between the two lines. In this example, we use it to plot actual values against planned values.
We then tidy up the chart by replacing the Legend with an alternative way of differentiating the two lines.
Find more great free tutorials at;
https://www.computergaga.com
*** Online Excel Courses ***
The Ultimate Excel Course – Learn Everything ► https://bit.ly/UltimateExcel
Excel VBA for Beginners ► http://bit.ly/37XSKfZ
Advanced Excel Tricks ► https://bit.ly/3CGCm3M
Excel Formulas Made Easy ► http://bit.ly/2ujtOAN
Creating Sports League Tables and Tournaments in Excel ► http://bit.ly/2Siivkm
Connect with us!
LinkedIn ► https://www.linkedin.com/company/18737946/
Instagram ► https://www.instagram.com/computergaga1/
Twitter ► http://www.twitter.com/computergaga1
Tags and Topics
Browse our collection to discover more content in these categories.
Video Information
Views
149.8K
Likes
809
Duration
8:15
Published
May 11, 2020
User Reviews
4.2
(29) Related Trending Topics
LIVE TRENDSRelated trending topics. Click any trend to explore more videos.
No specific trending topics match this video yet.
Explore All Trends