Create an Interactive Data Viz App with Python & Streamlit 🚀
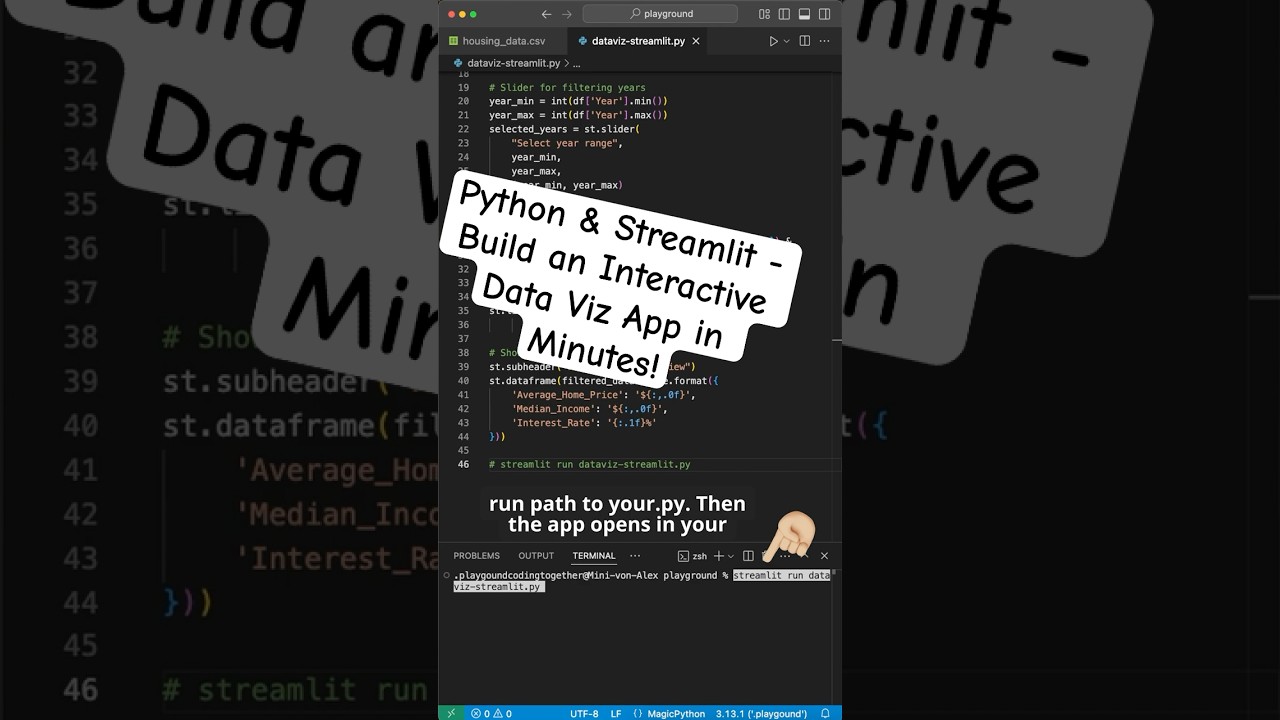
Build a simple, interactive data visualization app in Python under 50 lines using Streamlit and Pandas. Load CSVs and add dropdowns easily!
Coding Together
27.9K views • Feb 19, 2025
About this video
Build a simple interactive data visualization app in Python with less than 50 lines of code! Using Streamlit and Pandas, we load a CSV, add a dropdown for metrics, a slider for year selection, and generate live-updating charts—all in a few lines!
Background Music:
Rain, Book And Cup Of Tea by | e s c p | https://www.escp.space
https://escp-music.bandcamp.com
Background Music:
Rain, Book And Cup Of Tea by | e s c p | https://www.escp.space
https://escp-music.bandcamp.com
Tags and Topics
Browse our collection to discover more content in these categories.
Video Information
Views
27.9K
Likes
1.0K
Duration
2:13
Published
Feb 19, 2025
User Reviews
4.6
(5) Related Trending Topics
LIVE TRENDSRelated trending topics. Click any trend to explore more videos.
Trending Now