Power BI Interview Q&A: Fundamentals & Troubleshooting 🔥
Boost your Power BI knowledge with key interview questions and answers. Perfect for beginners and intermediates to understand core concepts.

CodeVisium
240 views • Sep 12, 2025
About this video
✅ Sharpen your Power BI fundamentals with these key interview questions & answers! Great for beginners/intermediate level to ensure clear understanding of core features and how to debug issues.
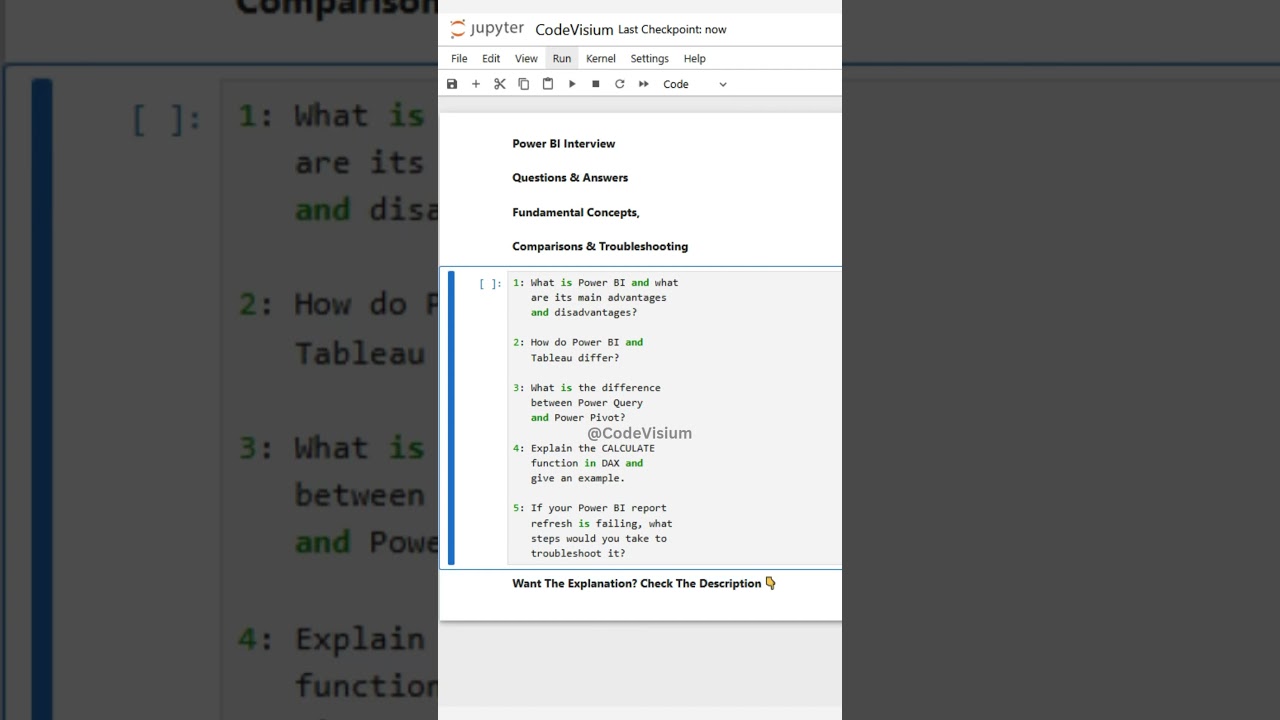
Q1: What is Power BI and what are its main advantages and disadvantages?
👉 Answer:
Power BI is Microsoft’s business intelligence and data visualization tool. It helps users connect to various data sources, transform and clean data, model it, create visuals/reports/dashboards, and share insights.
Advantages:
• User-friendly interface and drag-and-drop visuals.
• Strong integration with Microsoft ecosystem (Excel, Azure, etc.).
• Flexible data connectors and many visualization options.
Disadvantages:
• Performance issues with very large datasets unless optimized (e.g. with DirectQuery, aggregations).
• Some advanced customizations (especially visuals or transformations) can be complicated.
• Licensing and refresh limitations based on version (free, Pro, Premium).
Q2: How do Power BI and Tableau differ?
👉 Answer:
Power BI tends to have a shorter learning curve, especially for users familiar with Excel and Microsoft tools.
Tableau is often considered stronger in advanced visualizations and artistic flexibility; Power BI is more tightly integrated in Microsoft/Azure ecosystem.
Pricing/licensing models differ: Power BI often more cost-effective for many users, whereas Tableau may be more costly in enterprise contexts depending on scale.
Data source connectivity, refresh options, and embedding features differ; performance under large datasets may favor certain tools differently depending on architecture.
Q3: What is the difference between Power Query and Power Pivot?
👉 Answer:
Power Query is used to extract, transform, and load (ETL) data. You use it to clean, reshape, merge, filter data before loading into the model. It uses “M” language behind the scenes for advanced transformations.
Power Pivot is the data modeling component. It lets you define relationships between tables, create calculated columns/measures using DAX, build the model that visuals will use. It works after data is prepared.
Q4: Explain the CALCULATE function in DAX and give an example.
👉 Answer:
CALCULATE() is one of the most powerful DAX functions; it modifies filter context for a calculation. It takes an expression and one or more filters (or filter-modifying conditions) as arguments.
Example:
DAX TotalSalesEast = CALCULATE( SUM(Sales[Amount]), Sales[Region] = "East" )
This measure sums Sales[Amount] only for rows where Region is “East”.
Q5: If your Power BI report refresh is failing, what steps would you take to troubleshoot it?
👉 Answer:
Check if the data source is available (server or file).
Verify credentials or permissions aren’t expired or changed.
Ensure the gateway (if using on-premises data) is configured correctly and running.
Confirm if there are any changes to data schema (e.g. renamed or removed columns) that might break queries.
Look at refresh logs for error messages, check query timings or size of data.
If the dataset is very large, consider incremental refresh, partitioning, or reducing data volume.
Tags and Topics
Browse our collection to discover more content in these categories.
Video Information
Views
240
Likes
2
Duration
0:10
Published
Sep 12, 2025
Related Trending Topics
LIVE TRENDSRelated trending topics. Click any trend to explore more videos.
No specific trending topics match this video yet.
Explore All Trends