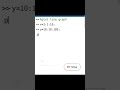
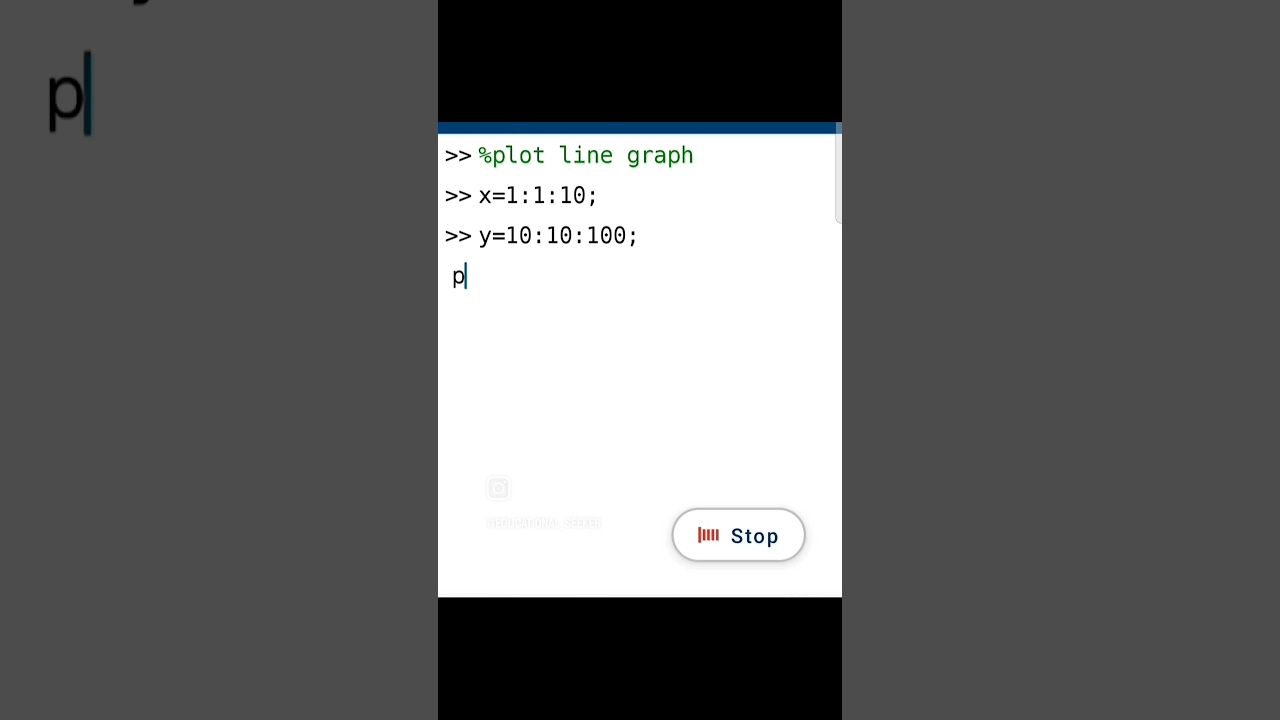
Create Line Graph in MATLAB 📊
Learn how to plot a line graph in MATLAB with simple steps and example code for clear visualization.
Matlab_classes
15.1K views • Jul 8, 2024
Video Information
Views
15.1K
Likes
101
Duration
0:24
Published
Jul 8, 2024
User Reviews
4.2
(3) Related Trending Topics
LIVE TRENDSRelated trending topics. Click any trend to explore more videos.
No specific trending topics match this video yet.
Explore All Trends