Mastering the Logistic Map with Staircase Diagrams 📊
Discover how staircase diagrams help visualize and analyze the complex behavior of the logistic map in discrete dynamical systems. Enhance your understanding of chaos and bifurcations easily!
Prof Ghrist Math
1.9K views • Aug 20, 2019
About this video
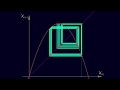
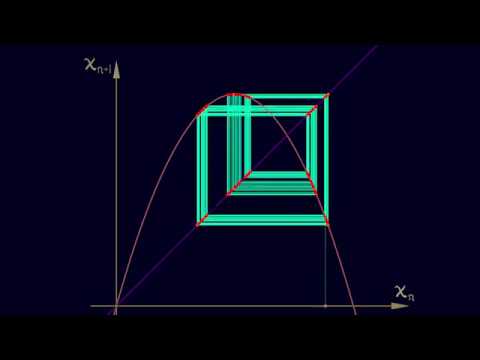
There are a number of tools available to understand discrete-time dynamical systems (or "maps"). In 1-d, one of the best of these is the "staircase diagram" that plot time-(n+1) versus time-(n) points in the plane. The logistic map (an inverted parabola) shows of most of the available dynamical features, from stable and unstable equilibria, to periodic orbits, bifurcation sequences, and chaos.
Tags and Topics
Browse our collection to discover more content in these categories.
Video Information
Views
1.9K
Likes
33
Duration
0:51
Published
Aug 20, 2019
User Reviews
4.5
(1) Related Trending Topics
LIVE TRENDSRelated trending topics. Click any trend to explore more videos.
No specific trending topics match this video yet.
Explore All Trends