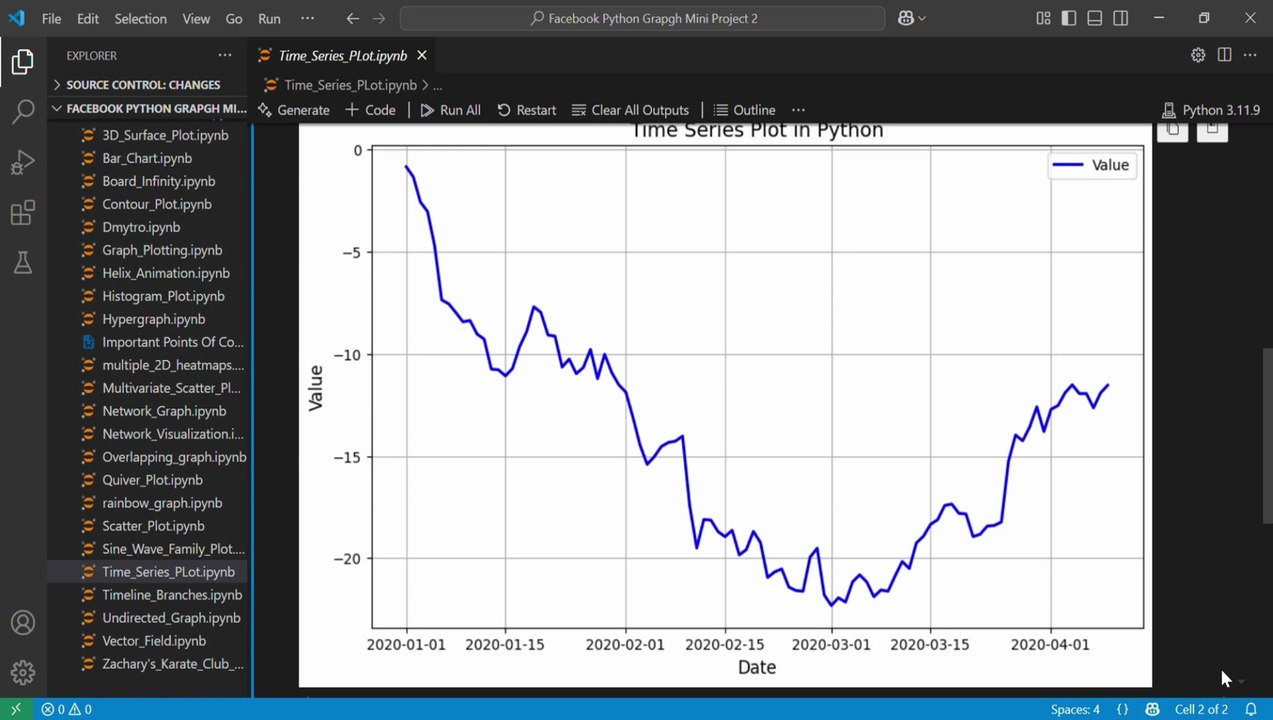
Master How to Create Beautiful Time Series Graphs in Python 📊
Learn step-by-step how to craft stunning and insightful time series plots with Python and Matplotlib. Perfect for visualizing your data effectively!
AI_Evolutionary Technology
12 views • Jul 9, 2025
About this video
Create Stunning Time Series Graphs in Python | Easy Tutorial<br />📊 In this tutorial, you'll learn how to create stunning time series plots using Python and Matplotlib! Whether you're a beginner or brushing up your data visualization skills, this video walks you through step-by-step — from generating time series data to customizing your graph with labels, grids, and legends.<br /><br />🎯 What you'll learn:<br /><br />How to create a time series using pandas<br /><br />How to use matplotlib to plot time-based data<br /><br />Customizing plot appearance (colors, labels, title, grid, etc.)<br /><br />Real-world tips for better data visualization<br /><br />📌 Tools Used:<br /><br />Python<br /><br />Pandas<br /><br />NumPy<br /><br />Matplotlib<br /><br />Perfect for data science, analytics, and anyone interested in Python plotting. No prior experience required!<br /><br />🔔 Don’t forget to Like, Subscribe, and hit the bell icon for more beginner-friendly Python tutorials.<br /><br />#TimeSeriesPlot #PythonPlotting #MatplotlibTutorial #Python #PythonDataVisualization #TimeSeriesInPython #DataVisualizationPython<br />#PythonForBeginners #MatplotlibTimeSeries #PandasTimeSeries<br />#PythonChartTutorial #PlotTimeSeriesPython #VisualizeDataPython<br />#LearnMatplotlib #PythonGraphTutorial #DataSciencePython<br />#PythonMatplotlibGuide
Video Information
Views
12
Duration
1:10
Published
Jul 9, 2025
Related Trending Topics
LIVE TRENDSRelated trending topics. Click any trend to explore more videos.
No specific trending topics match this video yet.
Explore All Trends