Master Excel Dashboard KPIs: Essential Tips & Tricks 📊
Discover how to create and customize KPI dashboards in Excel with easy tips. Learn to add backgrounds, shapes, and formatting for a professional look!

Rabi Gurung
18.6K views • Mar 22, 2025
About this video
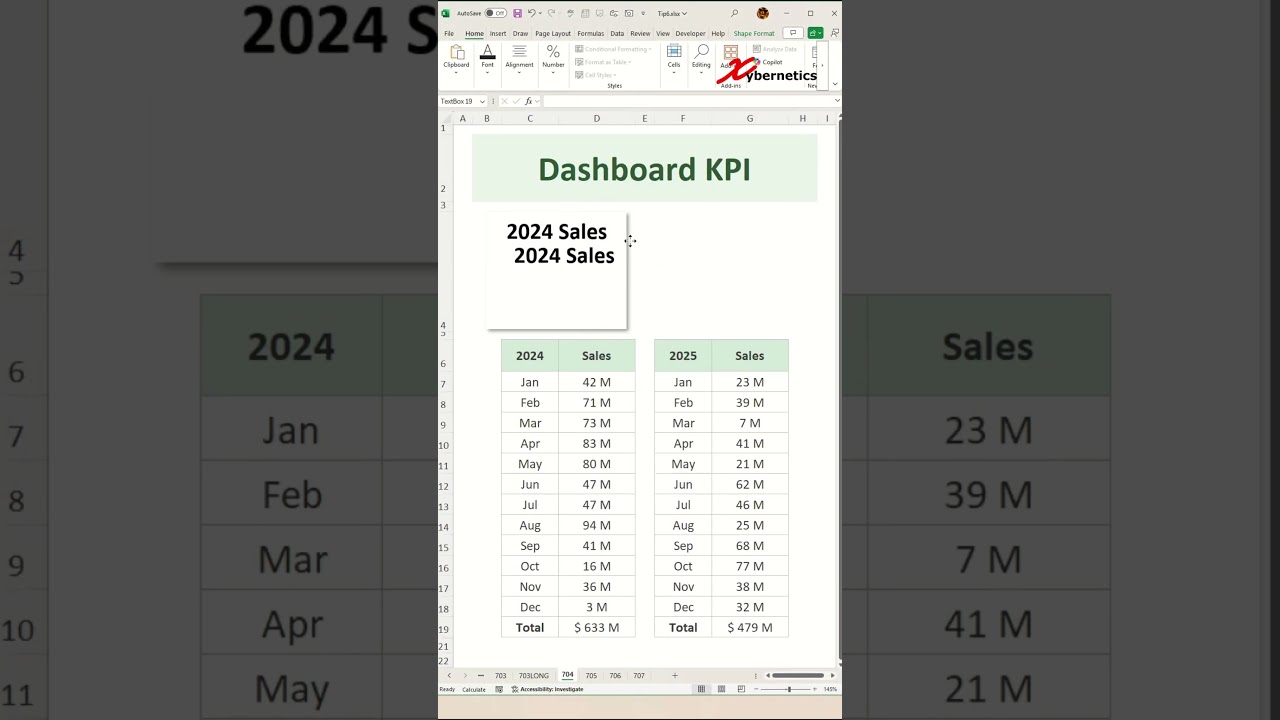
Learn how to create a dashboard fort KPI in Excel.
Add Background
1) Insert ~ Shapes ~ Rectangle
2) Insert a rectangle
3) Shape Format ~ Shape Fill set to white
4) No outline
5) Add shadow (Outer Bottom Right)
6) Resize and reposition text box
Title
1) Insert ~ Textbox
2) Enter title
3) Font size 24
Bold font
4) No fill and no border
5) Resize and reposition text box
Total Sales
1) Copy and past title
2) =$C$19
3) Font type to Impact
Font size 20
4) Fill = light green
5) Add shadow (Outer Bottom Right)
6) Resize and reposition total sales text box to make it look like a wrap around ribbon
Add Sparkline Bar Chart
1) Select D21
2) Insert ~ Sparklines ~ Column
3) Select Sales column
for 2024
4) Enter
5) Sparkline ~ High Point
6) Ctrl + C
7) Right-click ~ Paste Special...
8) Linked Picture
9) Resize and reposition Linked Picture
.
#tips #excel #microsoft #howto #tricks
Tags and Topics
Browse our collection to discover more content in these categories.
Video Information
Views
18.6K
Likes
595
Duration
2:31
Published
Mar 22, 2025
User Reviews
4.6
(3) Related Trending Topics
LIVE TRENDSRelated trending topics. Click any trend to explore more videos.
No specific trending topics match this video yet.
Explore All Trends