🔥 Master 3D Heatmap Layers in Python: Step-by-Step Tutorial
Learn how to create eye-catching 3D heatmap layers in Python for advanced data visualization. Perfect for transforming your data into professional, multilayered visual insights! 📊
AI_Evolutionary Technology
10 views • Jul 16, 2025
About this video
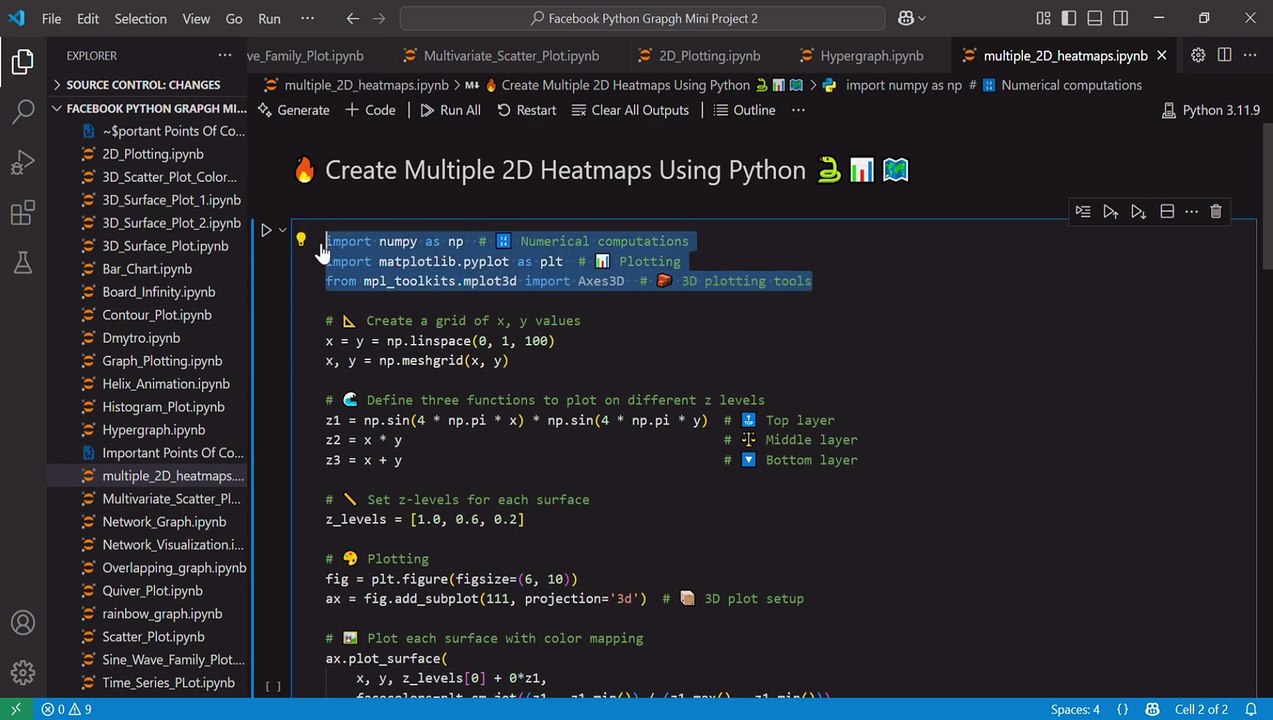
🔥 Create Stunning 3D Heatmap Layers in Python | Multilayer Data Visualization Tutorial<br />Transform your data into professional 3D heatmap layers with Python! In this tutorial, you’ll learn how to visualize multilayer datasets as stacked 3D surfaces using Matplotlib. Perfect for data science, research, or AI projects!<br />Github Link:https://github.com/nazishjaveed/Pytho...<br /><br />🔹 What You’ll Learn:<br />✅ Stack multiple 2D heatmaps in 3D space for clear comparisons<br />✅ Customize colors, layers, and perspectives for stunning visuals<br />✅ Fix common errors (like meshgrid vs meangrid and stride issues)<br />✅ Add axis labels, ticks, and adjust viewing angles like a pro<br /><br />📚 Perfect for: Data Scientists, Researchers, Python Enthusiasts, and Anyone Tired of Flat 2D Plots!<br /><br />💬 Got questions? Drop a comment below!<br />👍 Like & Subscribe for more Python/data viz tutorials!<br /><br /><br />#python #datavisualization #heatmap #3dplot #matplotlib #pythonvisualization #pythonplotting #pythontutorial #pythonmatplotlib <br />#multilayerheatmap #3dheatmap #python3dplot #dataviz #numpy <br />#coding #pythonforbeginners #advancedpython #techtutorial #3dheatmap #visualizationpython #learnpython #pythonprojects #pythontricks <br />#advancedpython #coding #techtutorial #pythontutorial #scientificcomputing #datascience #dataanalysis #datavisualization <br />#pythongraphing #matplotlibtutorial #matplotlib3d #3dplotting <br />#multilayervisualization
Video Information
Views
10
Duration
1:45
Published
Jul 16, 2025
Related Trending Topics
LIVE TRENDSRelated trending topics. Click any trend to explore more videos.
Trending Now