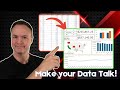
📊 Make Your Data Speak! Create an Interactive Google Sheets Dashboard
Want to transform raw data into an interactive, visually appealing dashboard in Google Sheets? In this step-by-step tutorial, I’ll show you how to build a dy...
Teacher's Tech
46.6K views • Mar 3, 2025
About this video
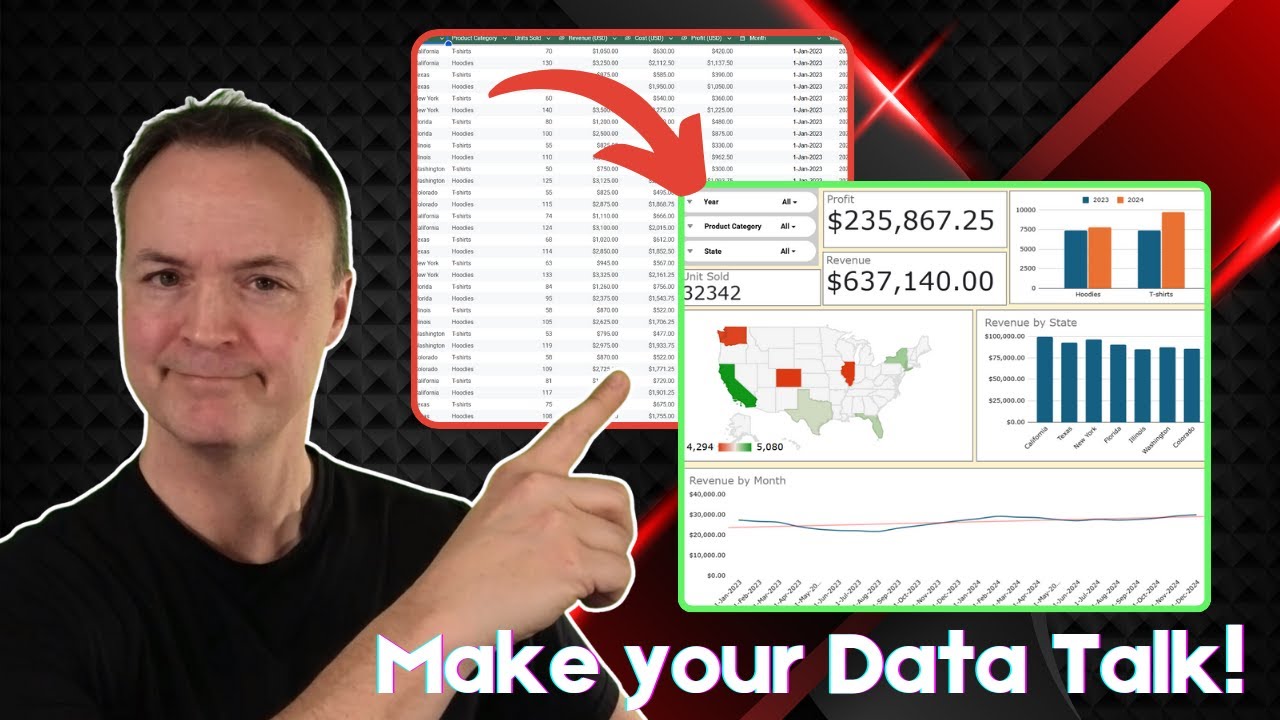
Want to transform raw data into an interactive, visually appealing dashboard in Google Sheets? In this step-by-step tutorial, I’ll show you how to build a dynamic dashboard with charts, filters, and interactive elements—no coding required!
Try @Taskade today! https://www.taskade.com/
Practice File: https://docs.google.com/spreadsheets/d/1gmQYzSbkXrhHt4nfPCXvhHGxJI9Hcj504Xq4_m9iE3k/edit?usp=sharing
🔹 In this video, you’ll learn:
✅ How to organize and structure your data
✅ How to create dynamic charts and graphs
✅ How to use drop-down filters for interactive reporting
✅ How to automate updates for real-time insights
✅ Tips & tricks for making your dashboard visually stunning
💡 Whether you're tracking business performance, financial trends, or project progress, this tutorial will help you turn your data into powerful insights with Google Sheets!
🎬 Watch now and start building your interactive dashboard today!
0:00 Introduction
1:06 Setting up your dashboard
3:13 Add slicers to your dashboard
7:03 Adding charts to your to dashboard
14:38 Create charts from Pivot Tables
21:13 Formatting the look of your dashboard
#taskadepartner
Tags and Topics
Browse our collection to discover more content in these categories.
Video Information
Views
46.6K
Likes
783
Duration
21:49
Published
Mar 3, 2025
User Reviews
4.7
(9) Related Trending Topics
LIVE TRENDSRelated trending topics. Click any trend to explore more videos.
No specific trending topics match this video yet.
Explore All Trends