Linear Regression Tutorial Part 2: Calculating & Visualizing the Line 📊
Learn how to compute the slope and y-intercept in linear regression and see the line plotted on the chart in this step-by-step guide.
Markplex
107 views • Jul 22, 2010
About this video
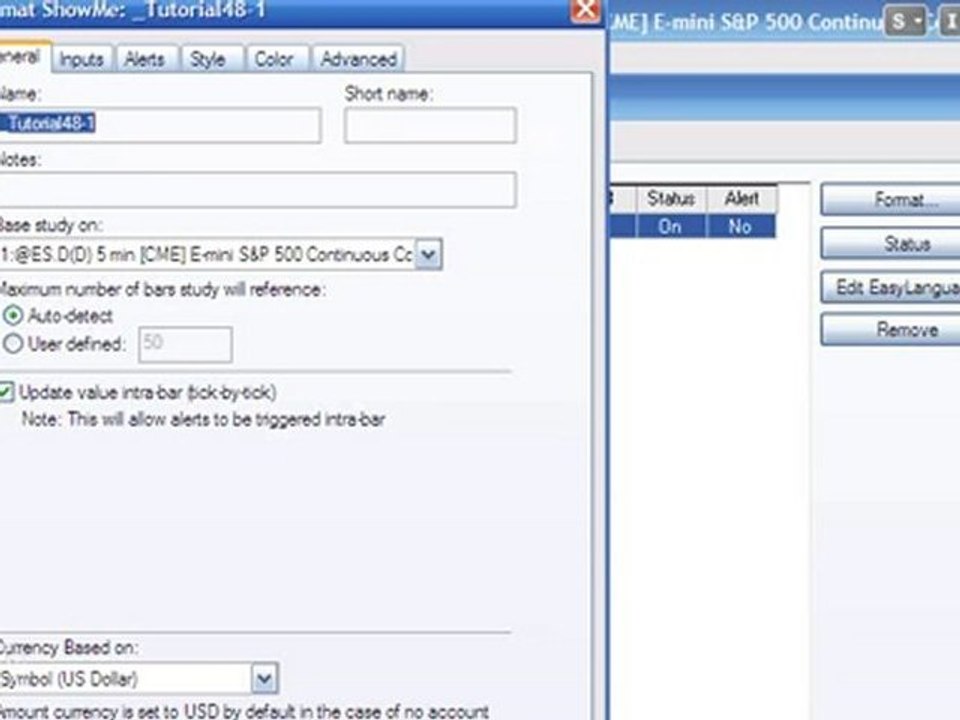
In part 2 of this two part tutorial describes the calculation of the slope and the y intercept of the line and draws the line on the chart.
Video Information
Views
107
Duration
4:41
Published
Jul 22, 2010
Related Trending Topics
LIVE TRENDSRelated trending topics. Click any trend to explore more videos.
No specific trending topics match this video yet.
Explore All Trends