Graphing Equations in Algebra - Lesson 2-1
This lesson covers how to graph equations in Algebra, providing step-by-step instructions and examples to help you understand the process.
Math and Science
9.0K views • Nov 28, 2022
About this video
More Lessons: http://www.MathAndScience.com
Twitter: https://twitter.com/JasonGibsonMath
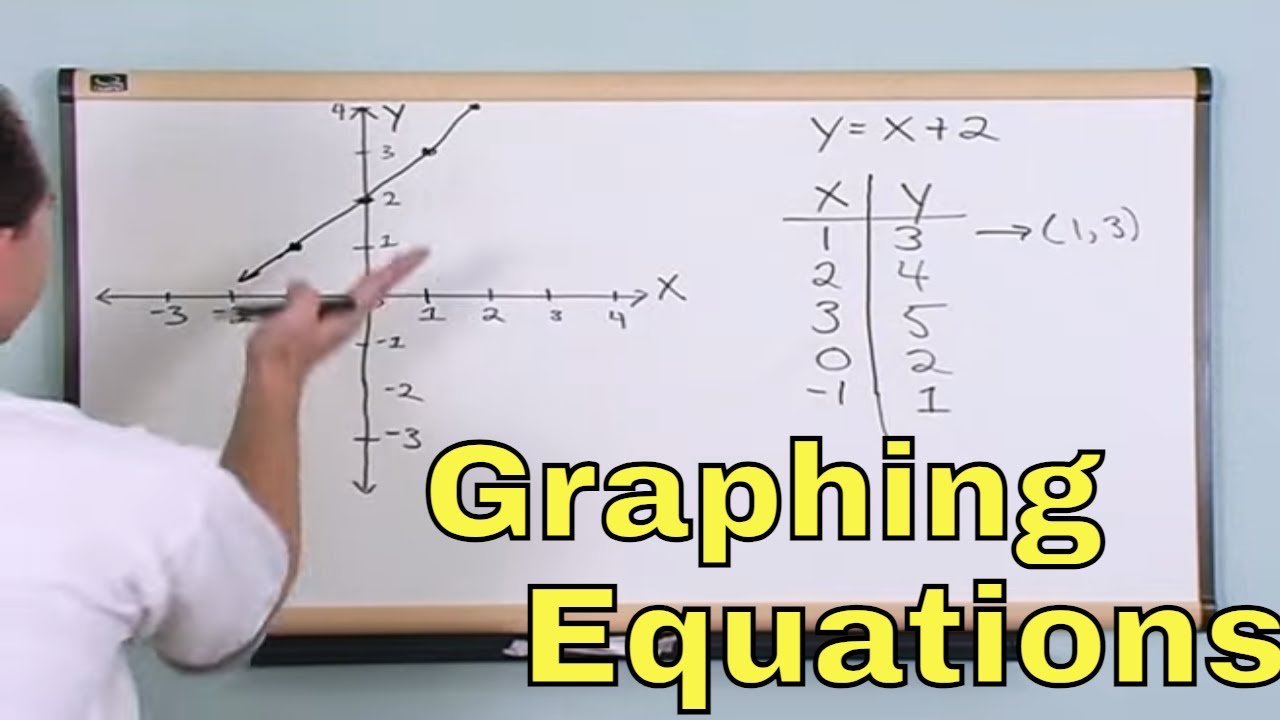
In this lesson, you will learn how to graph an equation in Algebra. We first learn that an equation consists of independent and dependent variables, then use this to create a table of values. We supply an input value to the function, which we call the independent variable, then calculate the output value, which we call the dependent variable. We then use these values construct (x,y) pairs of points and plot them on the xy plane. When graphing equations, we may obtain many different graphs. Most commonly we get a line, or linear, graph. We may also get a quadratic (parabola), or cubic graph or many other shapes.
Twitter: https://twitter.com/JasonGibsonMath
In this lesson, you will learn how to graph an equation in Algebra. We first learn that an equation consists of independent and dependent variables, then use this to create a table of values. We supply an input value to the function, which we call the independent variable, then calculate the output value, which we call the dependent variable. We then use these values construct (x,y) pairs of points and plot them on the xy plane. When graphing equations, we may obtain many different graphs. Most commonly we get a line, or linear, graph. We may also get a quadratic (parabola), or cubic graph or many other shapes.
Tags and Topics
Browse our collection to discover more content in these categories.
Video Information
Views
9.0K
Likes
252
Duration
36:03
Published
Nov 28, 2022
User Reviews
4.6
(1) Related Trending Topics
LIVE TRENDSRelated trending topics. Click any trend to explore more videos.
No specific trending topics match this video yet.
Explore All Trends