Master Power BI with BMW Sales Data: Step-by-Step Dashboard Tutorial 🚗
Learn how to transform BMW sales data into an interactive and visually stunning dashboard with this comprehensive Power BI tutorial. Perfect for data enthusiasts and professionals alike!

Abdelytics
18.8K views • Aug 24, 2024
About this video
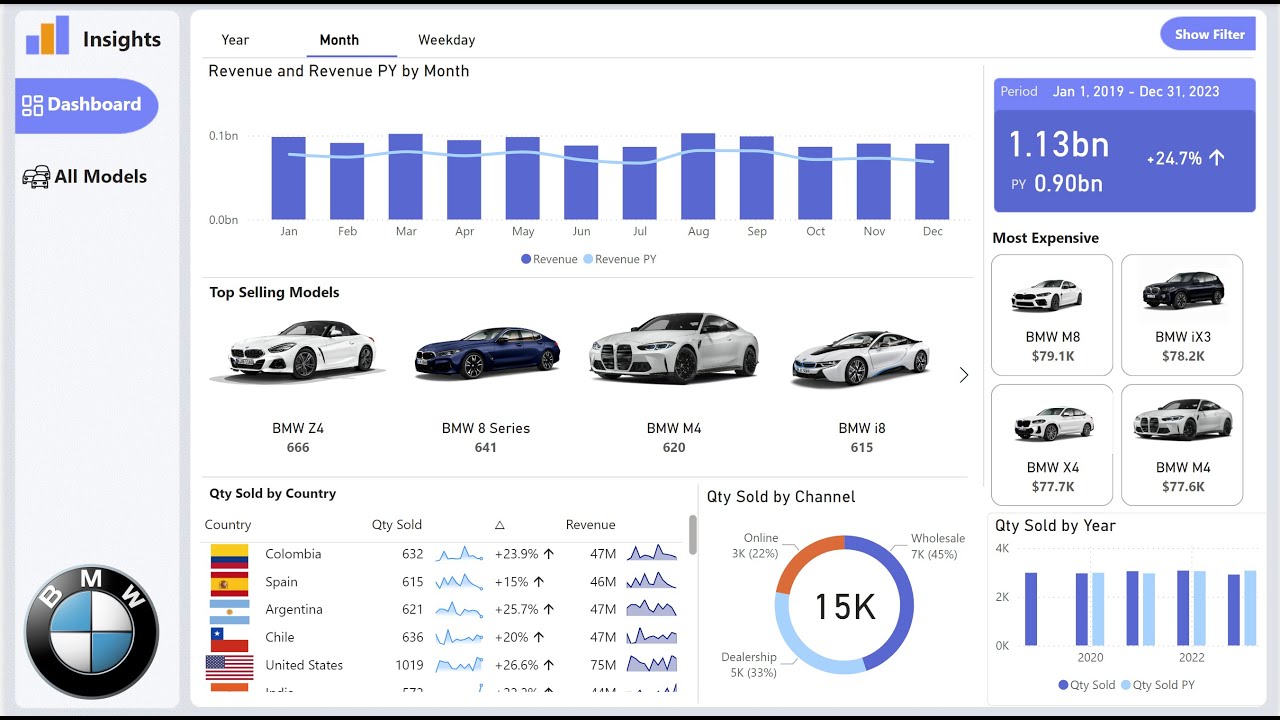
Welcome to my latest Power BI tutorial, where I take you through every step of creating a powerful and visually engaging BMW Sales Dashboard! 🚗
In this video, I’ll guide you from importing the raw sales data to building insightful visualizations that can help drive business decisions. Whether you're a beginner or an experienced Power BI user, this tutorial has something for everyone.
What you’ll learn:
- How to import and clean BMW sales data in Power BI
- Data modeling techniques to optimize your dashboard
- Step-by-step creation of various charts and KPIs
- How to create dynamic visualizations that tell a story
- Tips and tricks for making your dashboard more interactive and user-friendly
By the end of this video, you’ll have a fully functional dashboard that you can use to impress your colleagues or clients.
Don’t forget to like, comment, and subscribe for more Power BI tutorials! If you have any questions or need further clarification, feel free to drop them in the comments section. Happy dashboarding! 🎉
Link to the Power BI File: https://c132ec-bf.myshopify.com/products/bmw-sales-dashboard-template-power-bi-interactive-dashboard?utm_source=copyToPasteBoard&utm_medium=product-links&utm_content=web
Link to Dataset and images: https://drive.google.com/drive/folders/1KWjkTnr6PpPSraGD-6eHMhlXu9qi8DJe?usp=sharing
SVG Sparkline: https://kerrykolosko.com/portfolio-category/svg-templates/
Let's connect: https://www.linkedin.com/in/abdel-raouf-yessoufou-1a33756a/
Follow my pages:
https://web.facebook.com/share/g/17h5Lv5d2S/
https://www.linkedin.com/groups/10008167/
👉 For training, contact us on WhatsApp here: +233552122043
🔔 Like, comment, and subscribe for more Power BI content!
Tags and Topics
Browse our collection to discover more content in these categories.
Video Information
Views
18.8K
Likes
493
Duration
01:37:31
Published
Aug 24, 2024
User Reviews
4.6
(3) Related Trending Topics
LIVE TRENDSRelated trending topics. Click any trend to explore more videos.
No specific trending topics match this video yet.
Explore All Trends