Explore the 3D Visualization of the Riemann Zeta Function 🌐
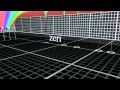
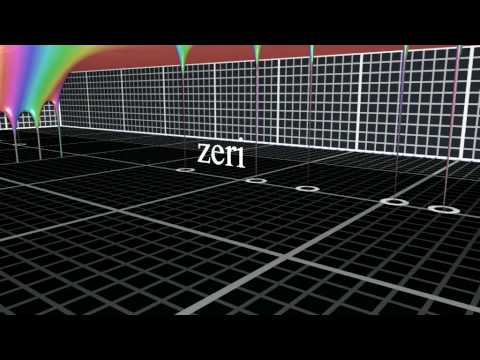
Discover a stunning 3D plot of the Riemann Zeta Function, showcasing its magnitude and phase. Dive into the complex behavior around its pole and unravel the mysteries of this fundamental mathematical function.
Gian Marco Todesco
63.5K views • Dec 15, 2009
About this video
3D plot of the Riemann Zeta Function. The height is the logarithm of the module; the color codes the argument. The pick at the center is the pole of the function for s=1. The "holes" are the zeros.
Animation created with POV-Ray (http://www.povray.org). Data computed with a custom C++ program, linked with the pari library (http://pari.math.u-bordeaux.fr/)
Laboratorio di Matematica formulas.it (http://www.formuls.it)
Centro matematita (http://www.matematita.it)
Animation created with POV-Ray (http://www.povray.org). Data computed with a custom C++ program, linked with the pari library (http://pari.math.u-bordeaux.fr/)
Laboratorio di Matematica formulas.it (http://www.formuls.it)
Centro matematita (http://www.matematita.it)
Tags and Topics
Browse our collection to discover more content in these categories.
Video Information
Views
63.5K
Likes
403
Duration
0:21
Published
Dec 15, 2009
User Reviews
4.2
(12) Related Trending Topics
LIVE TRENDSRelated trending topics. Click any trend to explore more videos.
No specific trending topics match this video yet.
Explore All Trends