Master Different Types of Charts for Better Data Visualization 📊
Learn essential chart types and how to use them effectively in data visualization. Perfect for beginners looking to enhance their data storytelling skills!

Electrical Engineering XYZ
7.8K views • Mar 27, 2025
About this video
📊 Different Types of Charts Explained | Data Visualization for Beginners 📊
Welcome to Electrical Engineering XYZ! In this video, we’ll explore the most popular types of charts used in data analysis, presentations, and engineering reports.
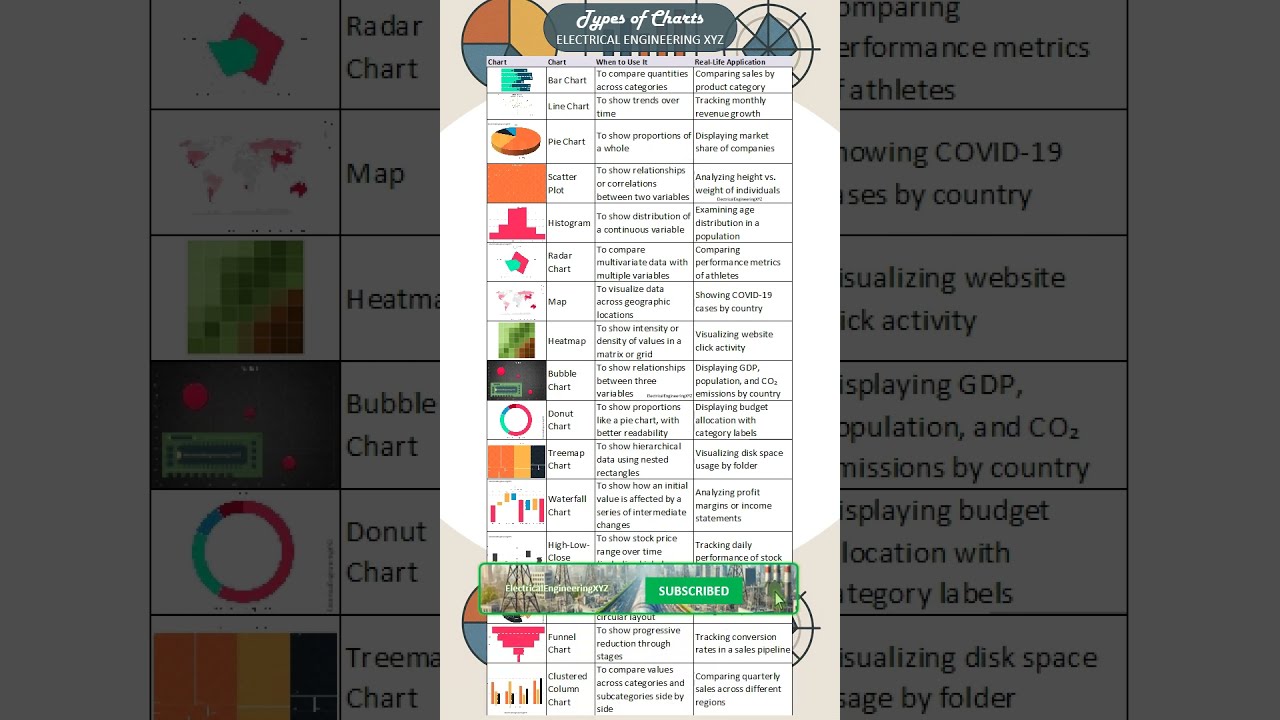
From the classic Bar and Line Charts to more advanced visualizations like Sunburst, Funnel, and Treemap Charts, you'll learn what each chart is, how it works, and when to use it effectively.
🔍 Charts covered in this video:
Bar Chart
Line Chart
Pie Chart
Scatter Plot
Histogram
Radar Chart
Map
Heatmap
Bubble Chart
Donut Chart
Treemap Chart
Waterfall Chart
High-Low-Close Chart
Sunburst Chart
Funnel Chart
Clustered Column Chart
✅ Whether you're a student, data analyst, engineer, or just curious—this video will help you visualize data like a pro!
📌 Don’t forget to like, subscribe, and comment with your favorite chart or what you'd like to see next.
#Charts #DataVisualization #EngineeringTools #ElectricalEngineeringXYZ #BarChart #PieChart #RadarChart
Welcome to Electrical Engineering XYZ! In this video, we’ll explore the most popular types of charts used in data analysis, presentations, and engineering reports.
From the classic Bar and Line Charts to more advanced visualizations like Sunburst, Funnel, and Treemap Charts, you'll learn what each chart is, how it works, and when to use it effectively.
🔍 Charts covered in this video:
Bar Chart
Line Chart
Pie Chart
Scatter Plot
Histogram
Radar Chart
Map
Heatmap
Bubble Chart
Donut Chart
Treemap Chart
Waterfall Chart
High-Low-Close Chart
Sunburst Chart
Funnel Chart
Clustered Column Chart
✅ Whether you're a student, data analyst, engineer, or just curious—this video will help you visualize data like a pro!
📌 Don’t forget to like, subscribe, and comment with your favorite chart or what you'd like to see next.
#Charts #DataVisualization #EngineeringTools #ElectricalEngineeringXYZ #BarChart #PieChart #RadarChart
Tags and Topics
Browse our collection to discover more content in these categories.
Video Information
Views
7.8K
Likes
84
Duration
0:11
Published
Mar 27, 2025
User Reviews
4.3
(1) Related Trending Topics
LIVE TRENDSRelated trending topics. Click any trend to explore more videos.
No specific trending topics match this video yet.
Explore All Trends