Create Stunning Web Data Visualizations with FusionCharts v3 📊
Discover how FusionCharts v3 suite enables you to build engaging and interactive data visualizations for your websites and applications. Watch the video to explore its powerful features!
fusionchartsteam
89 views • Jun 29, 2010
About this video
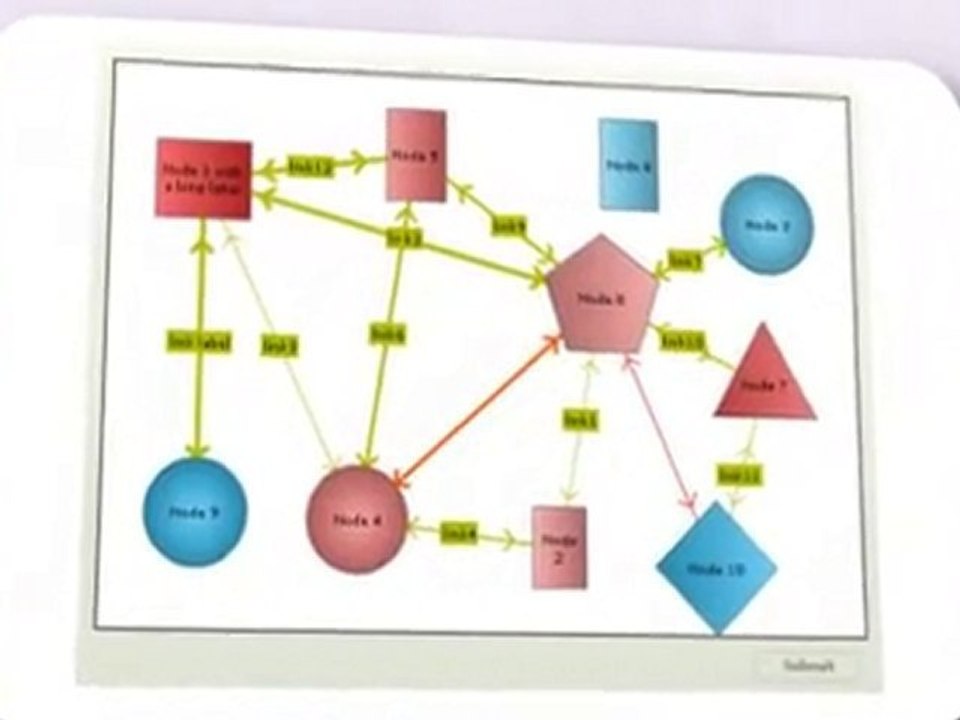
FusionCharts v3 suite helps you build awesome data visualizations for your websites and applications. This video showcases the various products present in FusionCharts v3 suite - FusionCharts, FusionWidgets, FusionMaps & PowerCharts. FusionCharts v3 helps you create animated and interactive Flash charts for web and desktop applications. It livens up your applications by converting monotonous data into exciting visuals. FusionCharts can be integrated with a myriad of web technologies like ASP, ASP.NET, PHP, JSP, ColdFusion, Ruby on Rails, Python or even simple HTML pages. It works with all databases including MS SQL, Oracle, MySQL, PostgreSQL, CSV or even legacy data storage. FusionCharts offers over 45 types of 2D/3D charts including line, area, bar, column, pie, doughnut (donut), combination, scatter, bubble, scroll charts etc. The functional and cosmetic aspects of each chart can be extensively customized using the XML API exposed by FusionCharts. You do not need to know anything about Flash™ to use FusionCharts. With over 12,000 customers and 150,000 users spread across 110 countries, FusionCharts is the leader in Flash Charting.
Video Information
Views
89
Duration
1:37
Published
Jun 29, 2010
Related Trending Topics
LIVE TRENDSRelated trending topics. Click any trend to explore more videos.
No specific trending topics match this video yet.
Explore All Trends