Master Data Exploration on Databricks: From Source to Visualization 🚀
Learn how to efficiently explore and visualize your data using Databricks in this quick, step-by-step tutorial. Perfect for accelerating your data analysis skills!

Databricks
6.2K views • Aug 31, 2015
About this video
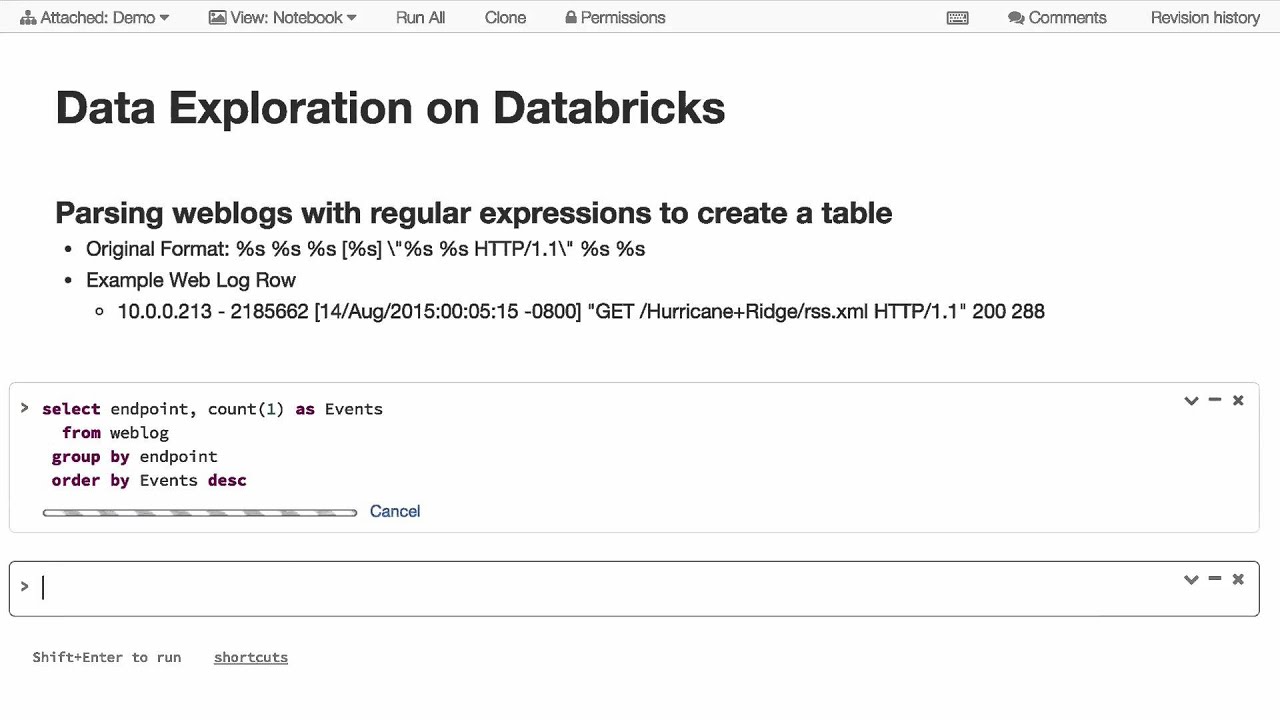
This Data Exploration on Databricks jump start video will show you how go from data source to visualization in a few easy steps. Specifically, we will take semi-structured logs, easily extract and transform them, analyze and visualize the data using Spark SQL, so we can quickly understand our data.
About: Databricks provides a unified data analytics platform, powered by Apache Spark™, that accelerates innovation by unifying data science, engineering and business.
Read more here: https://databricks.com/product/unified-data-analytics-platform
Connect with us:
Website: https://databricks.com
Facebook: https://www.facebook.com/databricksinc
Twitter: https://twitter.com/databricks
LinkedIn: https://www.linkedin.com/company/databricks
Instagram: https://www.instagram.com/databricksinc/ Databricks is proud to announce that Gartner has named us a Leader in both the 2021 Magic Quadrant for Cloud Database Management Systems and the 2021 Magic Quadrant for Data Science and Machine Learning Platforms. Download the reports here. https://databricks.com/databricks-named-leader-by-gartner
Tags and Topics
Browse our collection to discover more content in these categories.
Video Information
Views
6.2K
Likes
24
Duration
3:52
Published
Aug 31, 2015
User Reviews
4.0
(1) Related Trending Topics
LIVE TRENDSRelated trending topics. Click any trend to explore more videos.
No specific trending topics match this video yet.
Explore All Trends