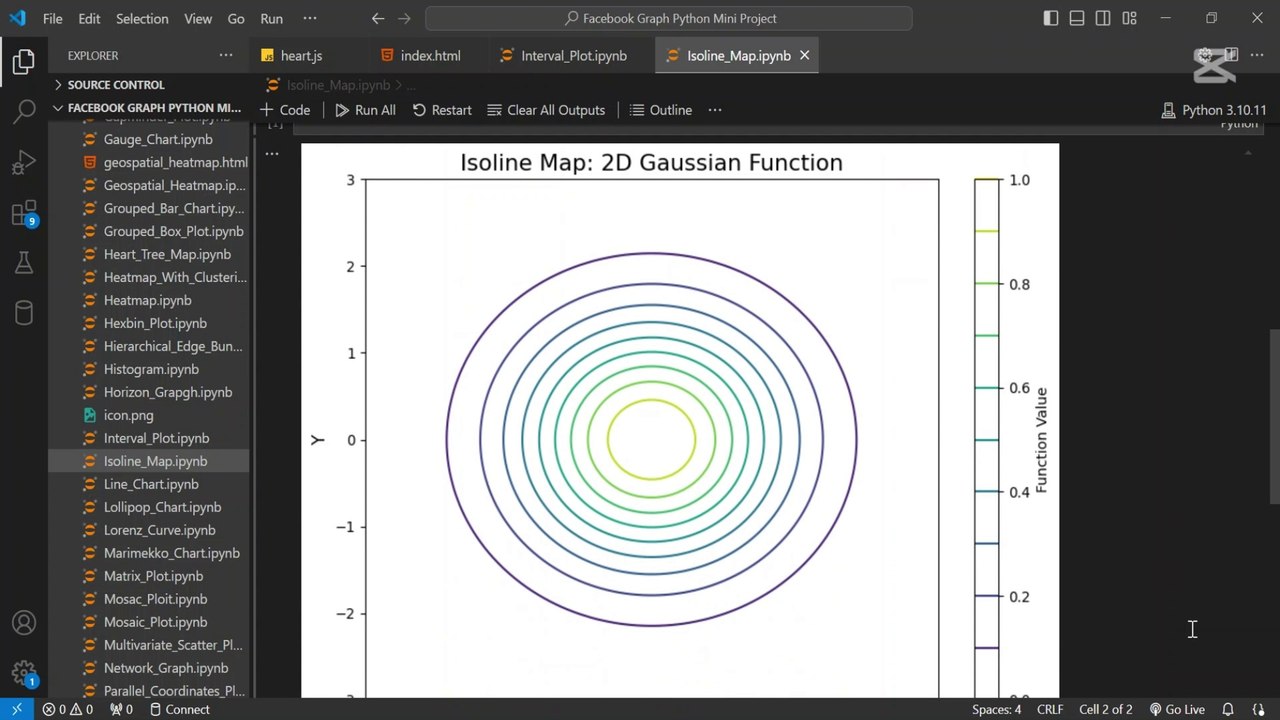
Create Isoline Maps in Python with Matplotlib 🗺️
Learn to make professional contour plots in Python with this step-by-step Matplotlib tutorial. Generate isoline maps easily!
AI_Evolutionary Technology
10 views • May 9, 2025
About this video
🔥 Learn how to create a professional Isoline Map (Contour Plot) in Python using Matplotlib!<br /><br />In this step-by-step tutorial, I’ll show you how to:<br />✅ Generate sample data (2D Gaussian distribution) using NumPy<br />✅ Plot isolines (contour plots) with Matplotlib<br />✅ Customize colors, labels, and style for clarity<br />✅ Add a colorbar and adjust the layout<br /><br />👍 Enjoyed this tutorial?<br /><br />Subscribe for more Python/data science content!<br /><br />Like the video if it helped you.<br /><br />Comment below with questions or requests!<br /><br />#Python #Matplotlib #DataVisualization #IsolineMap #ContourPlot #PythonTutorial #DataScience #NumPy #Coding #Programming #LearnPython #ScientificComputing #DataAnalysis #TechTutorial #PythonForBeginners
Video Information
Views
10
Duration
1:46
Published
May 9, 2025
Related Trending Topics
LIVE TRENDSRelated trending topics. Click any trend to explore more videos.