Complete Excel Data Analysis Portfolio Project (Beginner to Pro 2025)
Master Excel data analysis with this comprehensive project, covering the full cycle from data collection to dashboard creation. Ideal for beginners aiming to become proficient in sales data analysis by 2025.
Data Professionals
21.2K views • Feb 2, 2025
About this video
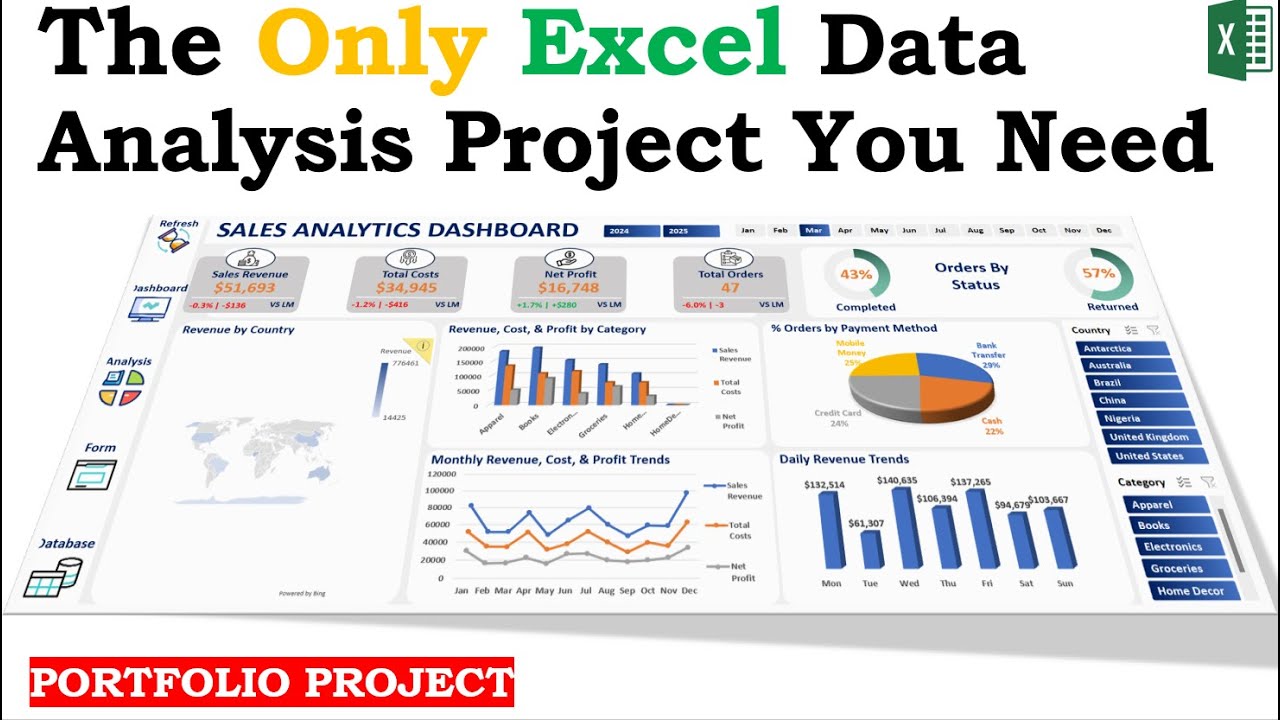
📊 Master Excel Data Analysis from Start to Finish! Sales Dashboard (2025 Project)
In this ultimate tutorial, I take you through a Complete Sales Data Analysis Project in Excel, covering everything you need to know—from data cleaning to creating a modern data entry form, processing and analyzing data, and building interactive visualizations. Perfect for beginners looking to become pros! 🚀
✅ What you'll learn:
Data Cleaning: Fix errors, remove duplicates, and prepare datasets.
Data Processing: Organize and transform data efficiently.
Data Analysis: Perform calculations and gain insights.
Data Collection: Create a modern data entry form that stores data automatically.
Data Visualization: Design professional dashboards and charts.
👉 To get the files: Copy this link and paste it into your browser:
https://drive.google.com/drive/folders/1MDdm5a-7_MN9z2STKRJh-L6RgJQPsYHa?usp=sharing
📌 Link to download icons:
https://www.flaticon.com/
📌Link to explore color combinations:
https://color.adobe.com/explore
🎥 Video Timestamps:
0:00 - Introduction
1:54 - Project Summary
2:45 - Data Cleaning
9:21 - Data Processing
15:12 - Data Analysis
28:36 - Data Collection
50:52 - Data Visualization
🔔 Don’t forget to like, comment, and subscribe for more data tutorials! 🌍
🔗 For collaboration or networking, feel free to reach out to me here:
dataprofessionals237@gmail.com
#ExcelDashboard, #Excel, #DataVisualization, #salesdashboard, #dataanalytics, #statisticalanalysis
Tags and Topics
Browse our collection to discover more content in these categories.
Video Information
Views
21.2K
Likes
711
Duration
02:55:05
Published
Feb 2, 2025
User Reviews
4.6
(4) Related Trending Topics
LIVE TRENDSRelated trending topics. Click any trend to explore more videos.
No specific trending topics match this video yet.
Explore All Trends