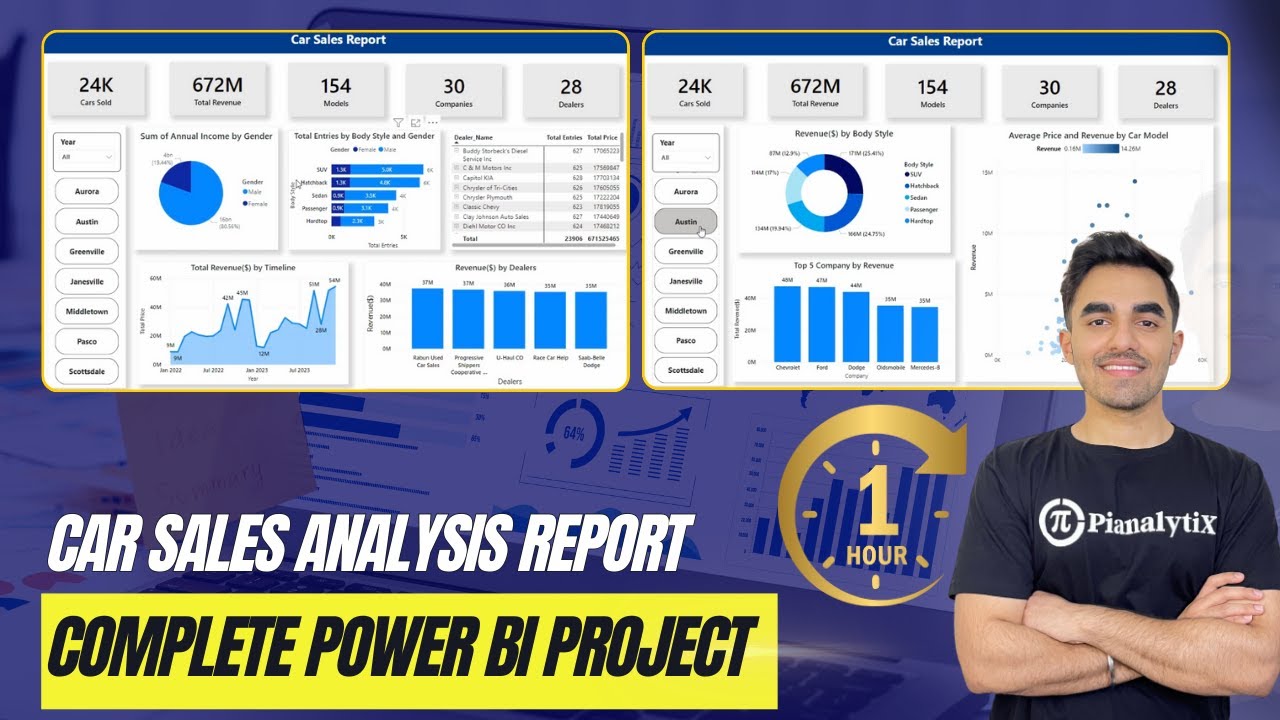
Car Sales Power BI Report: Complete Step-by-Step Tutorial 🚗
Discover how to create a comprehensive Car Sales Analysis report in Power BI with this easy-to-follow, multi-page project tutorial. Perfect for data enthusiasts and analysts!

PianalytiX
1.4K views • Nov 26, 2024
About this video
🚗 Car Sales Power BI Report Project 📊
Dive into the world of data analytics with this hands-on Power BI project focused on Car Sales Analysis. Learn how to create a dynamic and interactive dashboard that visualizes key metrics like sales trends, regional performance, top-performing car models, and much more.
This project is perfect for anyone looking to enhance their Power BI skills and apply them to real-world business problems. Whether you're a beginner or an experienced user, mastering Car Sales Analysis in Power BI will boost your ability to turn raw data into actionable insights.
🔑 Why Learn This Project?
Build a professional-grade dashboard for car sales analysis.
Learn to visualize metrics like year-over-year growth, regional sales trends, and top models.
Apply Power BI features like slicers, filters, and DAX for advanced insights.
Gain skills applicable in industries like automotive, retail, and business intelligence.
Enhance your portfolio with a real-world Power BI project that showcases your expertise.
Whether you're pursuing a career in data analytics or want to learn how to present impactful reports, this Car Sales Power BI Project is a must-have addition to your skillset.
📢 Who Is This For?
Beginners eager to explore Power BI dashboards.
Business Analysts seeking actionable insights from car sales data.
Data professionals looking to create visually stunning reports.
Anyone interested in data visualization and business intelligence.
You can download the dataset and the PBIX project file for this tutorial from the following GitHub repository:
https://github.com/pianalytix/Car-Sales-Analysis-Complete-Project-in-Power-BI
📢 Don’t Miss Out!
👍 Like this video to support more Power BI content!
💬 Comment below with your favorite Power BI visualization!
🔔 Subscribe for tutorials, tips, and real-world Power BI projects.
-- - - - - - - - - - - - - - - - - - - - - -
You can download the dataset and the PBIX project file for this tutorial from the following GitHub repository:
https://github.com/pianalytix/Car-Sales-Analysis-Complete-Project-in-Power-BI
-- - - - - - - - - - - - - - - - - - - - - -
🌐 Visit Pianalytix for More Resources:
🔗 Website: https://pianalytix.com
Visit our website to access 300+ Data Science, Power BI, and Development projects.
-- - - - - - - - - - - - - - - - - - - - - -
📲 Connect with Pianalytix:
✅ Instagram: https://www.instagram.com/pianalytix.official/
✅ LinkedIn: https://www.linkedin.com/company/pianalytix/
✅ YouTube: https://m.youtube.com/@pianalytixofficial
-- - - - - - - - - - - - - - - - - - - - - -
📘 Explore Our Courses on Udemy:
📌 Build 45 Real-World Power BI Projects for BI & Data Analysts:
https://www.udemy.com/course/data-analytics-course-power-bi-tableau/?couponCode=NOV2024
📌 Data Science Bundle: 180 Hands-On Projects:
https://www.udemy.com/course/data-science-projects-mastering-the-real-life-analytics/?couponCode=NOV2024
📌 100 Days of Code: Real-World Data Science Projects Bootcamp:
https://www.udemy.com/course/hands-on-data-science-build-real-world-projects/?couponCode=NOV2024
-- - - - - - - - - - - - - - - - - - - - - -
#PowerBI #CarSalesReport #BusinessIntelligence
#PowerBIDashboard #DataVisualization #SalesAnalysis
#PowerBIProjects #BIReports
Tags and Topics
Browse our collection to discover more content in these categories.
Video Information
Views
1.4K
Likes
37
Duration
01:05:59
Published
Nov 26, 2024
User Reviews
4.5
(1) Related Trending Topics
LIVE TRENDSRelated trending topics. Click any trend to explore more videos.
No specific trending topics match this video yet.
Explore All Trends