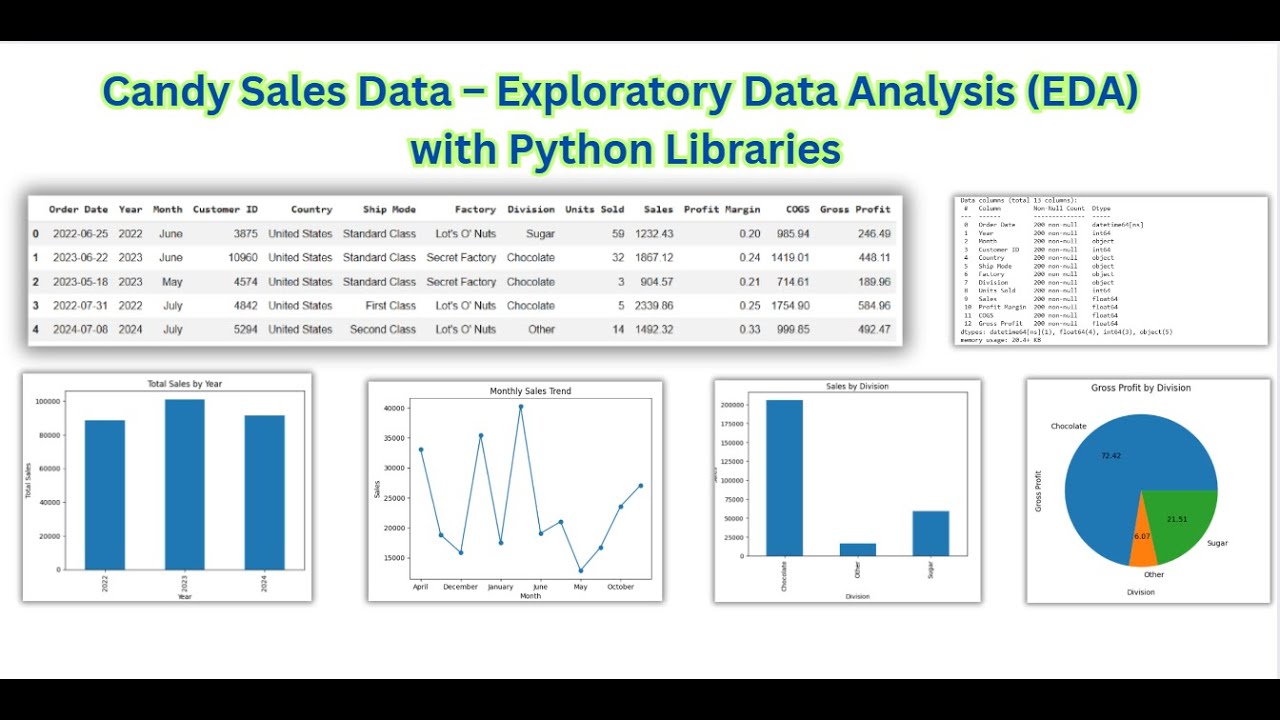
Candy Sales Data Analysis with Python 📊
Explore candy sales data using Python libraries in this comprehensive EDA project on Google Colab.

SlideScope
46 views • Jan 16, 2026
About this video
📊 Python EDA Project | Candy Sales Dataset Analysis Using Python (Google Colab)
In this video, I walk you through a complete Python Exploratory Data Analysis (EDA) project using a real-world Candy Sales dataset. This tutorial is designed for beginners and aspiring data analysts who want to learn how to analyze business data using Python in Google Colab without confusion.
You’ll learn how to:
Load Excel datasets into Python using pandas
Understand dataset structure, columns, and data types
Perform statistical analysis to summarize numerical data
Analyze sales trends by year and month
Compare sales and profit across product divisions
Visualize business insights using bar charts, line graphs, and scatter plots
Interpret graphs from a business and decision-making perspective
This project follows a step-by-step, line-by-line coding approach, where every Python line is explained in simple language. You can directly copy the code into Google Colab and follow along while understanding what each line does — perfect for students, working professionals, and content creators.
📥 Download the dataset used in this video:
https://shorturl.at/Dx1Ph
If you’re preparing for Data Analyst interviews, building your Python portfolio, or learning EDA for the first time, this video will give you a strong foundation.
Don’t forget to like, share, and subscribe for more real-world Python data analysis projects.
🔖 Hashtags
#PythonEDA #DataAnalysis #PythonForBeginners #GoogleColab #Pandas #DataAnalytics #EDAProjects
Video Information
Views
46
Duration
17:54
Published
Jan 16, 2026
Related Trending Topics
LIVE TRENDSRelated trending topics. Click any trend to explore more videos.
No specific trending topics match this video yet.
Explore All Trends