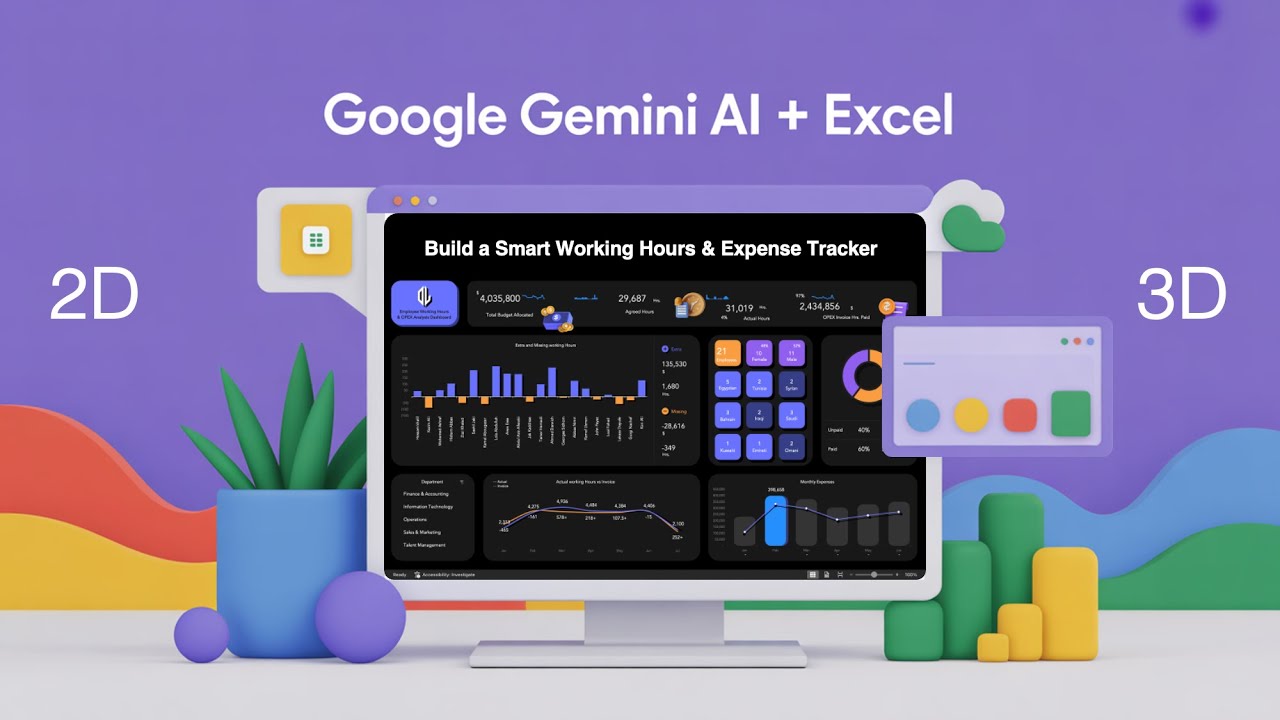
Create 3D Dashboards in Excel with Gemini AI
Learn to build stunning 3D dashboards in Excel using Gemini AI. Explore top templates and tools at Other Levels for professional analysis. 📊
Other Level’s
6.4K views • Aug 7, 2025
About this video
https://www.other-levels.com
🌍 🏅 The #1 Website Worldwide for Excel Dashboard Templates, Reports, and Professional Analysis Tools.
🎖️ 🏆 Other Levels YouTube Channel — The #1 Authority for Excel Dashboards on YouTube, with over 24 million views and a global impact.
💼 Other Levels Services
* Custom Excel Dashboard Service https://other-levels.com/products/custom-excel-dashboard-service
* Enhance Your Templates Service https://other-levels.com/products/enhance-your-templates-service
🎓 Master Excel Dashboards
Join over 100,000 learners in our top-rated online course and gain the skills to create professional Excel dashboards from scratch.
👉 Enroll today: https://other-levels.com/products/master-microsoft-excel-dashboards-online-course
To watch the full Tutorials? Join our channel Membership https://www.youtube.com/channel/UCuDF09RGFE3V3lY77Z_cA9g/join
🎓 Free Excel Courses On YouTube:
Single Dynamic Excel Dashboard https://www.youtube.com/playlist?list=PLxuBYEpUjhDsVA2O1FTayFiYrDfoErdbx
Multiple Dynamic Excel Dashboards https://www.youtube.com/playlist?list=PLxuBYEpUjhDuAfwWMEgnYirso6UXMzPB9
Have a question about this template?
👇🏻Comment down below
Let’s connect on social
LinkedIn https://www.linkedin.com/company/other-levels-com
Facebook https://www.facebook.com/Other.levels.Official
Instagram https://www.instagram.com/other.levels
TikTok https://www.tiktok.com/@other.levels
Playlists
Data Analysis By Power Point https://youtube.com/watch
PowerPoint Slides https://youtube.com/watch
CV/Resume Templates https://youtube.com/watch
Organizational Structure Chart https://www.youtube.com/watch
PowerPoint Templates https://youtube.com/watch
PowerPoint Dashboard https://youtube.com/watch
Modern Excel Reports https://youtube.com/watch
⭐️ Get ready to supercharge your Excel skills and create something truly groundbreaking! We're talking about interactive learning dashboards powered by Google's Gemini AI – tools that can understand, adapt, and teach users like never before. This isn't just about formulas; it's about building an intelligent learning experience right inside Excel that will impress everyone."
The Excel Learning Revolution
- Highlight the current limitations of traditional Excel-based learning (static, boring, low retention).
- Introduce the "aha!" moment: Imagine Excel as a dynamic, personalized tutor.
- Tease the powerful transformation Gemini AI brings to this vision.
00:00 Start – Welcome to Other Levels
00:06 Excel Dashboard with Gemini AI – Overview
00:13 How Gemini AI helps create PivotTables and formulas
00:25 Copying AI-generated formulas into Excel
00:31 Finalizing Excel Dashboard – Next Steps
00:43 PivotTables and Formulas – Already Created
00:54 Start Dashboard Layout – New Sheet Setup
01:05 Ask Gemini for Layout Design Suggestions
01:20 Apply Gemini’s Layout – Step by Step
01:27 Dark Theme and Modern Styling in Excel
01:33 Add Dashboard Title and Company Logo
01:46 Insert Rounded Rectangle and Text Box
02:20 Insert Logo and Position it in Excel
02:28 Ask Gemini for 3D Design Ideas
02:35 Create 3D Effect Using Shapes in Excel
02:48 Duplicate Shape and Add Depth with Color
03:05 Align Shapes for 3D Appearance
03:16 Apply 3D Styling Across the Dashboard
03:28 Add Key Metrics to Dashboard Top Section
03:34 Link Text Boxes to PivotTable Data
03:48 Add Budget, Hours, and OPEX KPIs
04:00 Creative Design – Modern KPI Layouts
04:12 Align Values, Titles, and Symbols Smartly
04:24 Continue Adding KPIs – Agreed vs Actual Hours
04:31 Insert 3D Icons for Better Visualization
04:44 Use 3D Icons Matching Brand Theme
04:57 Place Icons Across the Dashboard
05:04 Dashboard Now Looks Impressive – What's Next?
05:09 Add Sparkline Charts for Quick Trends
05:16 Select Sparkline Target Cell
05:22 Insert Sparklines for Employee Activity
05:35 Link to PivotTable Data for Sparklines
05:45 Sparklines Add Compact Data Trends
05:53 Refine Top Section of Dashboard
06:05 Switch to Dark Gray Background Area
06:11 Insert Shape Instead of Cell Fill
06:18 Format Shape with No Fill + Solid Line
06:33 Increase Line Width for Background Effect
06:47 Align Shape as Rounded Section Background
06:58 Maintain Consistent Dashboard Style
07:04 Clean and Balanced Dashboard Finish
07:12 End of Hands-On Excel Tutorial
07:18 Gemini AI Makes Dashboard Creation Easy
07:30 What’s Coming in Next Videos – Advanced Features
07:44 Download Dashboard Excel File – other-levels.com
07:57 Practice With Training Dataset Included
08:02 Build Your Own Dashboards with Confidence
08:08 Like, Subscribe, and Turn on Notifications
#exceldashboard #geminiai #interactivelearning
Tags and Topics
Browse our collection to discover more content in these categories.
Video Information
Views
6.4K
Likes
175
Duration
8:32
Published
Aug 7, 2025
User Reviews
4.6
(1) Related Trending Topics
LIVE TRENDSRelated trending topics. Click any trend to explore more videos.
No specific trending topics match this video yet.
Explore All Trends